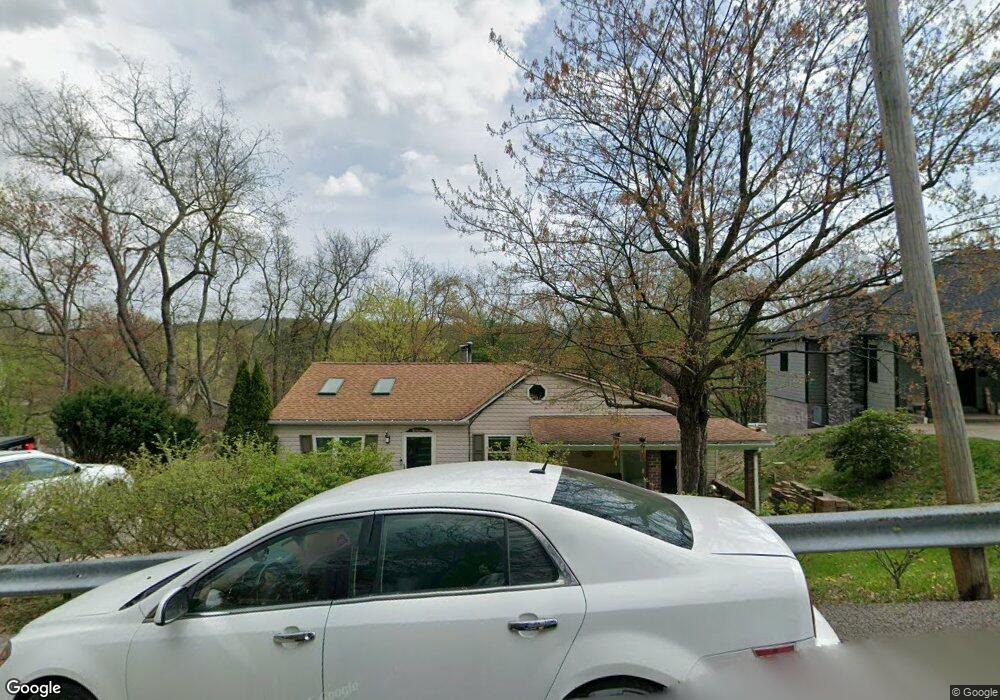
110 Valleyvue Dr Pittsburgh, PA 15237
Ross Township NeighborhoodEstimated Value: $171,000 - $265,503
3
Beds
2
Baths
1,316
Sq Ft
$177/Sq Ft
Est. Value
About This Home
This home is located at 110 Valleyvue Dr, Pittsburgh, PA 15237 and is currently estimated at $232,876, approximately $176 per square foot. 110 Valleyvue Dr is a home located in Allegheny County with nearby schools including McIntyre Elementary School, North Hills Middle School, and North Hills Senior High School.
Ownership History
Date
Name
Owned For
Owner Type
Purchase Details
Closed on
Sep 27, 2006
Sold by
Olszewski James M
Bought by
Swann Vance G
Current Estimated Value
Home Financials for this Owner
Home Financials are based on the most recent Mortgage that was taken out on this home.
Original Mortgage
$48,500
Outstanding Balance
$29,069
Interest Rate
6.54%
Mortgage Type
New Conventional
Estimated Equity
$203,807
Purchase Details
Closed on
May 6, 1983
Bought by
Swann Vance G and Swann Tammy A
Create a Home Valuation Report for This Property
The Home Valuation Report is an in-depth analysis detailing your home's value as well as a comparison with similar homes in the area
Home Values in the Area
Average Home Value in this Area
Purchase History
| Date | Buyer | Sale Price | Title Company |
|---|---|---|---|
| Swann Vance G | $43,500 | -- | |
| Swann Vance G | $23,000 | -- |
Source: Public Records
Mortgage History
| Date | Status | Borrower | Loan Amount |
|---|---|---|---|
| Open | Swann Vance G | $48,500 |
Source: Public Records
Tax History Compared to Growth
Tax History
| Year | Tax Paid | Tax Assessment Tax Assessment Total Assessment is a certain percentage of the fair market value that is determined by local assessors to be the total taxable value of land and additions on the property. | Land | Improvement |
|---|---|---|---|---|
| 2025 | $2,496 | $92,000 | $20,000 | $72,000 |
| 2024 | $2,496 | $92,000 | $20,000 | $72,000 |
| 2023 | $2,496 | $92,000 | $20,000 | $72,000 |
| 2022 | $2,435 | $92,000 | $20,000 | $72,000 |
| 2021 | $435 | $92,000 | $20,000 | $72,000 |
| 2020 | $2,399 | $92,000 | $20,000 | $72,000 |
| 2019 | $2,363 | $92,000 | $20,000 | $72,000 |
| 2018 | $435 | $92,000 | $20,000 | $72,000 |
| 2017 | $2,321 | $92,000 | $20,000 | $72,000 |
| 2016 | $435 | $92,000 | $20,000 | $72,000 |
| 2015 | $435 | $92,000 | $20,000 | $72,000 |
| 2014 | $2,271 | $92,000 | $20,000 | $72,000 |
Source: Public Records
Map
Nearby Homes