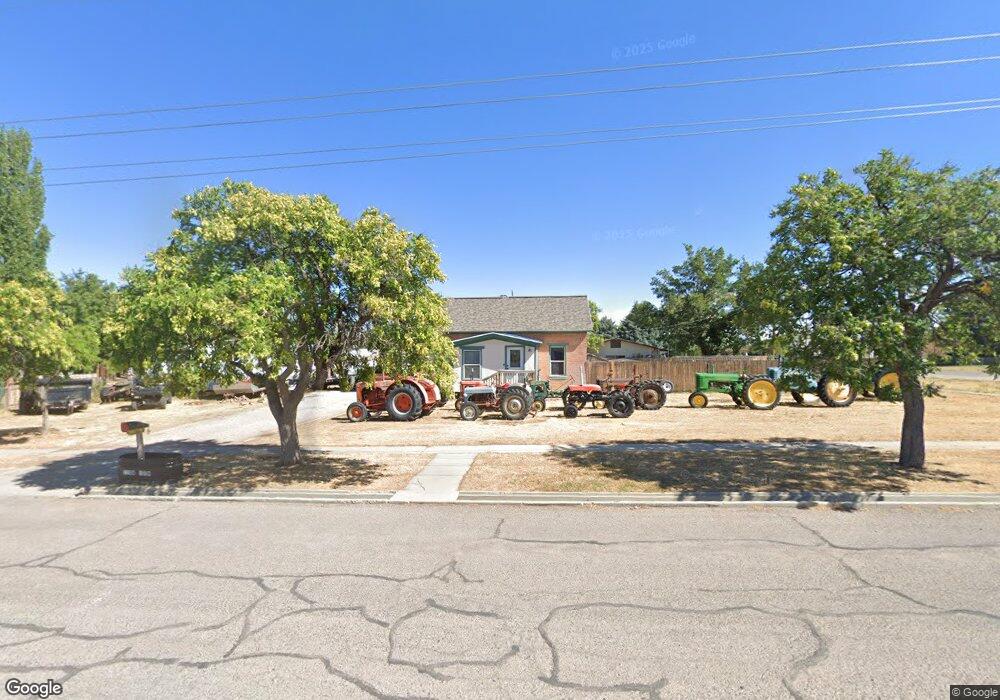
110 W 100 N Fillmore, UT 84631
Estimated Value: $202,000 - $302,000
2
Beds
1
Bath
1,314
Sq Ft
$194/Sq Ft
Est. Value
About This Home
This home is located at 110 W 100 N, Fillmore, UT 84631 and is currently estimated at $254,426, approximately $193 per square foot. 110 W 100 N is a home located in Millard County.
Ownership History
Date
Name
Owned For
Owner Type
Purchase Details
Closed on
Mar 25, 2024
Sold by
Anderson Jerold D and Anderson Sydney
Bought by
Harrison Quinn A and Harrison Erica Ruth
Current Estimated Value
Purchase Details
Closed on
Jul 14, 2020
Sold by
Ransdell Ryan M
Bought by
Anderson Sydney and Anderson Jerold D
Purchase Details
Closed on
Jun 11, 2007
Sold by
Rolling Assets Inc
Bought by
Ransdell Rick M and Ransdell Lori Ann
Purchase Details
Closed on
Dec 21, 2006
Sold by
Bank Of New York
Bought by
Rolling Asets Inc
Purchase Details
Closed on
Aug 1, 2006
Sold by
Matheson Stuart T and Stutz Michael C
Bought by
Bank Of New York
Create a Home Valuation Report for This Property
The Home Valuation Report is an in-depth analysis detailing your home's value as well as a comparison with similar homes in the area
Home Values in the Area
Average Home Value in this Area
Purchase History
| Date | Buyer | Sale Price | Title Company |
|---|---|---|---|
| Harrison Quinn A | -- | First American Title Insurance | |
| Anderson Sydney | -- | None Available | |
| Ransdell Rick M | -- | -- | |
| Rolling Asets Inc | -- | -- | |
| Bank Of New York | $53,550 | -- |
Source: Public Records
Tax History
| Year | Tax Paid | Tax Assessment Tax Assessment Total Assessment is a certain percentage of the fair market value that is determined by local assessors to be the total taxable value of land and additions on the property. | Land | Improvement |
|---|---|---|---|---|
| 2025 | $1,185 | $148,844 | $24,969 | $123,875 |
| 2024 | $1,185 | $108,226 | $20,292 | $87,934 |
| 2023 | $1,204 | $108,226 | $20,292 | $87,934 |
| 2022 | $1,043 | $93,689 | $18,448 | $75,241 |
| 2021 | $908 | $78,262 | $11,979 | $66,283 |
| 2020 | $839 | $72,721 | $10,890 | $61,831 |
| 2019 | $717 | $62,378 | $10,890 | $51,488 |
| 2018 | $684 | $60,926 | $10,890 | $50,036 |
| 2017 | $564 | $47,704 | $10,890 | $36,814 |
| 2016 | $539 | $47,704 | $10,890 | $36,814 |
| 2015 | $539 | $47,704 | $10,890 | $36,814 |
| 2014 | -- | $47,704 | $10,890 | $36,814 |
| 2013 | -- | $47,704 | $10,890 | $36,814 |
Source: Public Records
Map
Nearby Homes
- 75 N 100 West St
- 225 W 200 St N
- 155 W Center St
- 245 W 300 N
- 40 S 100 Rd E
- 390 N 100 W
- 351 W 100 South St
- 260 W 200 S
- 335 W 400 North St
- 220 S 200 E
- 235 S 200 St E
- 310 S 500 West Rd
- 465 S 100 W
- 410 W 400 N
- 155 E 500 St S
- 157 E 500 South St
- 405 E 500 St S
- 690 E 500 S
- 760 E 700 St S
- 750 800 South Fillmore
Your Personal Tour Guide
Ask me questions while you tour the home.