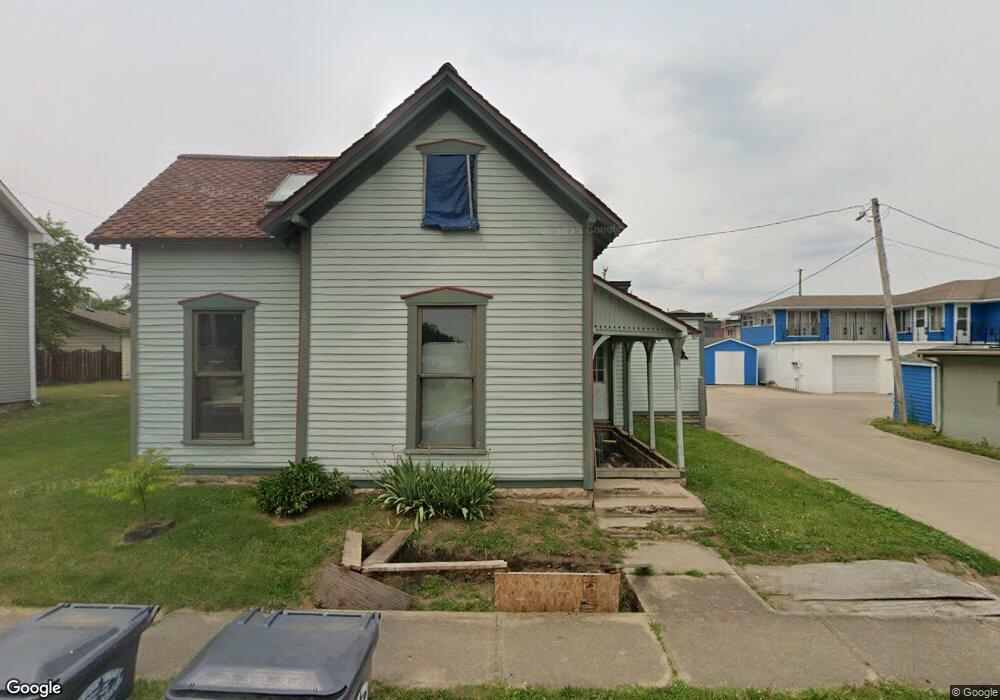
110 W High St Pendleton, IN 46064
Estimated Value: $208,000 - $306,000
2
Beds
1
Bath
1,360
Sq Ft
$179/Sq Ft
Est. Value
About This Home
This home is located at 110 W High St, Pendleton, IN 46064 and is currently estimated at $243,813, approximately $179 per square foot. 110 W High St is a home located in Madison County with nearby schools including Pendleton Elementary School and Pendleton Heights Middle School.
Ownership History
Date
Name
Owned For
Owner Type
Purchase Details
Closed on
Jul 28, 2017
Sold by
Wayne Purkey Dorin
Bought by
Robert Post Chrles
Current Estimated Value
Home Financials for this Owner
Home Financials are based on the most recent Mortgage that was taken out on this home.
Original Mortgage
$100,000
Outstanding Balance
$51,645
Interest Rate
3.88%
Mortgage Type
New Conventional
Estimated Equity
$192,168
Purchase Details
Closed on
Jan 7, 2017
Sold by
Purkey Dorin Wayne
Bought by
Purkey Dorin Wayne and Purkey Cindy L
Create a Home Valuation Report for This Property
The Home Valuation Report is an in-depth analysis detailing your home's value as well as a comparison with similar homes in the area
Home Values in the Area
Average Home Value in this Area
Purchase History
| Date | Buyer | Sale Price | Title Company |
|---|---|---|---|
| Robert Post Chrles | $100,000 | -- | |
| Post Charles Robert | $100,000 | Crossroads Title Agency Llc | |
| Purkey Dorin Wayne | -- | -- |
Source: Public Records
Mortgage History
| Date | Status | Borrower | Loan Amount |
|---|---|---|---|
| Open | Post Charles Robert | $100,000 |
Source: Public Records
Tax History
| Year | Tax Paid | Tax Assessment Tax Assessment Total Assessment is a certain percentage of the fair market value that is determined by local assessors to be the total taxable value of land and additions on the property. | Land | Improvement |
|---|---|---|---|---|
| 2025 | $2,608 | $138,300 | $24,300 | $114,000 |
| 2024 | $2,608 | $130,400 | $24,300 | $106,100 |
| 2023 | $2,388 | $119,400 | $23,100 | $96,300 |
| 2022 | $2,246 | $112,300 | $21,900 | $90,400 |
| 2021 | $2,092 | $104,600 | $21,900 | $82,700 |
| 2020 | $2,202 | $104,100 | $20,900 | $83,200 |
| 2019 | $2,004 | $100,200 | $20,900 | $79,300 |
| 2018 | $1,870 | $93,500 | $20,900 | $72,600 |
| 2017 | $727 | $87,900 | $19,300 | $68,600 |
| 2016 | $726 | $87,900 | $19,300 | $68,600 |
| 2014 | $752 | $86,600 | $19,300 | $67,300 |
| 2013 | $752 | $90,900 | $19,300 | $71,600 |
Source: Public Records
Map
Nearby Homes
- 315 W High St
- 110 W Water St
- 201 N East St
- 400 E Water St
- 1000 East St
- 513 W State St
- 227 Jefferson St
- 460 E Madison Ave
- 238 Jefferson St
- 621 S Silver St
- 644 Center St
- 720 S Broadway St
- 0 W State St
- 9806 Olympic Blvd
- 8093 Ridge Line Dr
- 637 Kilmore Dr
- 8094 Ridge Line Dr
- 305 Waterford Ln
- 7160 Murph Way
- 6758 Honeysuckle Way
Your Personal Tour Guide
Ask me questions while you tour the home.