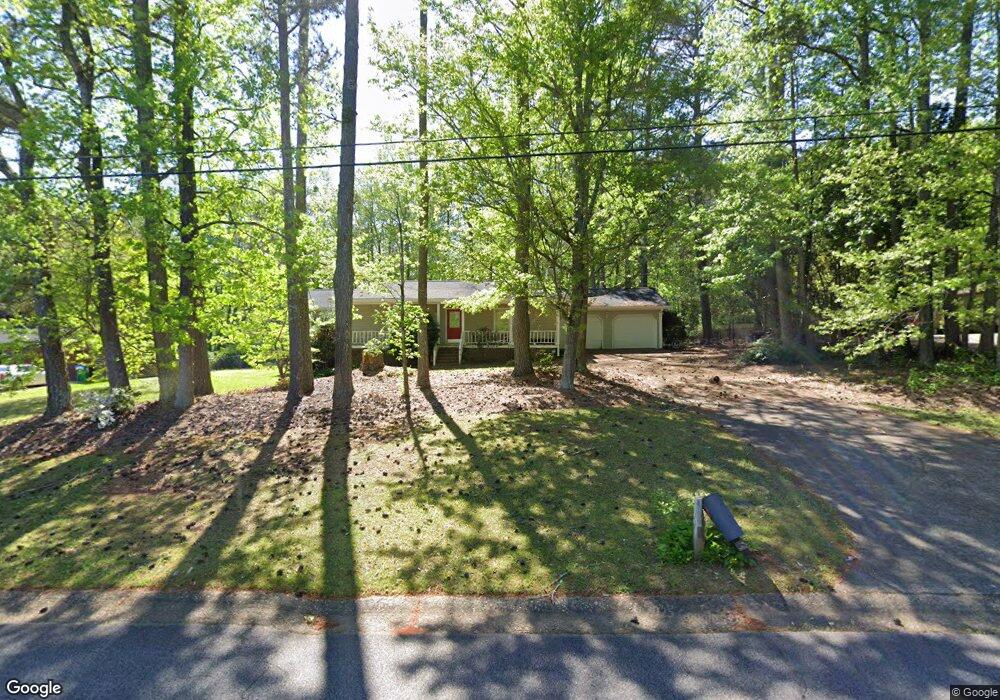
110 W Honeysuckle Ln Carrollton, GA 30116
Abilene NeighborhoodEstimated Value: $244,121 - $273,000
3
Beds
2
Baths
1,446
Sq Ft
$177/Sq Ft
Est. Value
About This Home
This home is located at 110 W Honeysuckle Ln, Carrollton, GA 30116 and is currently estimated at $256,530, approximately $177 per square foot. 110 W Honeysuckle Ln is a home located in Carroll County with nearby schools including Sand Hill Elementary School, Bay Springs Middle School, and Villa Rica High School.
Ownership History
Date
Name
Owned For
Owner Type
Purchase Details
Closed on
Feb 16, 2010
Sold by
Sprinkle Robert W
Bought by
Hewman Mary Lynn
Current Estimated Value
Purchase Details
Closed on
May 29, 2009
Sold by
Secretary Of Veterans Affa
Bought by
Sprinkle Robert W
Home Financials for this Owner
Home Financials are based on the most recent Mortgage that was taken out on this home.
Original Mortgage
$44,700
Interest Rate
4.77%
Mortgage Type
New Conventional
Purchase Details
Closed on
Jan 6, 2009
Sold by
First Horizon Home Loans
Bought by
Secretary Of Veterns Affairs
Purchase Details
Closed on
Oct 30, 1998
Sold by
Richards Robby
Bought by
Snell George W
Purchase Details
Closed on
Jun 1, 1993
Sold by
Camp Steven and Camp Leann
Bought by
Richards Robby
Purchase Details
Closed on
Aug 13, 1992
Sold by
Camp Steven
Bought by
Camp Steven and Camp Leann
Create a Home Valuation Report for This Property
The Home Valuation Report is an in-depth analysis detailing your home's value as well as a comparison with similar homes in the area
Home Values in the Area
Average Home Value in this Area
Purchase History
| Date | Buyer | Sale Price | Title Company |
|---|---|---|---|
| Hewman Mary Lynn | $110,000 | -- | |
| Sprinkle Robert W | $55,900 | -- | |
| Secretary Of Veterns Affairs | $86,000 | -- | |
| Snell George W | $92,900 | -- | |
| Richards Robby | $65,000 | -- | |
| Camp Steven | -- | -- |
Source: Public Records
Mortgage History
| Date | Status | Borrower | Loan Amount |
|---|---|---|---|
| Previous Owner | Sprinkle Robert W | $44,700 |
Source: Public Records
Tax History Compared to Growth
Tax History
| Year | Tax Paid | Tax Assessment Tax Assessment Total Assessment is a certain percentage of the fair market value that is determined by local assessors to be the total taxable value of land and additions on the property. | Land | Improvement |
|---|---|---|---|---|
| 2025 | $2,026 | $90,590 | $7,200 | $83,390 |
| 2024 | $2,049 | $90,590 | $7,200 | $83,390 |
| 2023 | $2,049 | $83,051 | $7,200 | $75,851 |
| 2022 | $1,419 | $68,096 | $7,200 | $60,896 |
| 2021 | $1,297 | $59,402 | $7,200 | $52,202 |
| 2020 | $1,187 | $53,229 | $7,200 | $46,029 |
| 2019 | $1,122 | $49,129 | $7,200 | $41,929 |
| 2018 | $1,033 | $43,365 | $7,200 | $36,165 |
| 2017 | $981 | $41,261 | $6,000 | $35,261 |
| 2016 | $982 | $41,261 | $6,000 | $35,261 |
| 2015 | $1,098 | $43,248 | $6,000 | $37,248 |
| 2014 | $1,102 | $43,248 | $6,000 | $37,248 |
Source: Public Records
Map
Nearby Homes
- 125 Sweet Bay Ln
- 0 Dock Hyde Rd Unit 10627769
- 79 Oak Wood Dr
- 15 Pine Chase
- 509 Tree Ridge Dr
- 22 Shell Rd
- 55 Sage Hill Dr
- 135 Mccoy Dr
- 377 Dock Hyde Rd
- 119 Muscadine Way
- 125 Muscadine Way
- 74 Holly Dr
- 208 Holliday Way
- 53 Holiday Dr
- 61 Holly Cir
- 136 Jennifer Ln
- 4 Maple Hill Rd
- 18 Dyer Cir
- 130 Garden Ridge Dr
- 27 Mimosa Cir
- 100 W Honeysuckle Ln
- 105 W Honeysuckle Ln
- 90 W Honeysuckle Ln
- 115 W Honeysuckle Ln
- 130 W Honeysuckle Ln
- 85 W Honeysuckle Ln
- 10 Blackberry Ln
- 10 Blackberry Ln
- 20 Sweet Bay Ln
- 80 W Honeysuckle Ln
- 60 Sweet Bay Ln
- 15 Blackberry Ln
- 150 W Honeysuckle Ln
- W W Honeysuckle Ln
- 165 W Honeysuckle Ln
- 60 W Honeysuckle Ln
- 160 W Honeysuckle Ln
- 67 Sweet Bay Ln
- 10 Sweet Bay Ln
- 65 W Honeysuckle Ln