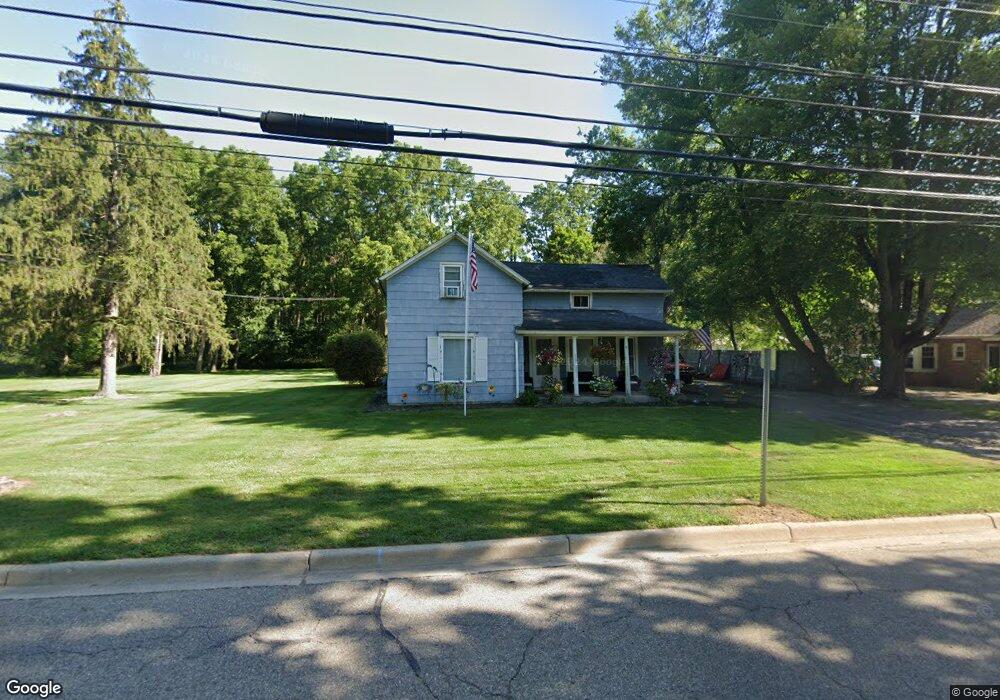
110 W Hughes St Marshall, MI 49068
Estimated Value: $165,000 - $235,000
4
Beds
2
Baths
1,520
Sq Ft
$137/Sq Ft
Est. Value
About This Home
This home is located at 110 W Hughes St, Marshall, MI 49068 and is currently estimated at $207,763, approximately $136 per square foot. 110 W Hughes St is a home located in Calhoun County with nearby schools including Harrington Elementary School, Marshall High School, and Marshall Academy.
Ownership History
Date
Name
Owned For
Owner Type
Purchase Details
Closed on
Jun 5, 2024
Sold by
Maurer Marilyn A
Bought by
Marrod Properties Llc
Current Estimated Value
Purchase Details
Closed on
Aug 8, 2005
Sold by
Thick William F and Thick Mary L
Bought by
Maurer Marilyn A
Home Financials for this Owner
Home Financials are based on the most recent Mortgage that was taken out on this home.
Original Mortgage
$65,600
Interest Rate
5.66%
Mortgage Type
Fannie Mae Freddie Mac
Purchase Details
Closed on
Mar 29, 2002
Sold by
Austin Joseph E
Bought by
Thick William F and Thick Mary L
Purchase Details
Closed on
Mar 15, 2000
Sold by
Shepherd Benjamin L and Shepherd Deborah
Bought by
Austin Joseph E
Purchase Details
Closed on
Aug 21, 1997
Sold by
Rapp Joan
Bought by
Shepherd Benjamin L and Shepherd Deborah
Purchase Details
Closed on
Sep 10, 1993
Sold by
Rapp Douglas and Rapp Mary
Bought by
Rapp Joan
Create a Home Valuation Report for This Property
The Home Valuation Report is an in-depth analysis detailing your home's value as well as a comparison with similar homes in the area
Home Values in the Area
Average Home Value in this Area
Purchase History
| Date | Buyer | Sale Price | Title Company |
|---|---|---|---|
| Marrod Properties Llc | -- | None Listed On Document | |
| Maurer Marilyn A | $82,000 | Chicago Title | |
| Thick William F | $77,000 | -- | |
| Austin Joseph E | $68,000 | -- | |
| Shepherd Benjamin L | $55,000 | -- | |
| Rapp Joan | -- | -- |
Source: Public Records
Mortgage History
| Date | Status | Borrower | Loan Amount |
|---|---|---|---|
| Previous Owner | Maurer Marilyn A | $65,600 |
Source: Public Records
Tax History Compared to Growth
Tax History
| Year | Tax Paid | Tax Assessment Tax Assessment Total Assessment is a certain percentage of the fair market value that is determined by local assessors to be the total taxable value of land and additions on the property. | Land | Improvement |
|---|---|---|---|---|
| 2025 | $3,944 | $77,500 | $0 | $0 |
| 2024 | $1,044 | $71,500 | $0 | $0 |
| 2023 | $3,548 | $69,100 | $0 | $0 |
| 2022 | $2,575 | $60,100 | $0 | $0 |
| 2021 | $3,801 | $59,800 | $0 | $0 |
| 2020 | $3,294 | $54,000 | $0 | $0 |
| 2019 | $0 | $51,000 | $0 | $0 |
| 2018 | $0 | $51,700 | $19,000 | $32,700 |
| 2017 | $0 | $48,400 | $0 | $0 |
| 2016 | $0 | $47,000 | $0 | $0 |
| 2015 | -- | $43,400 | $0 | $0 |
| 2014 | -- | $42,300 | $0 | $0 |
Source: Public Records
Map
Nearby Homes
- 127 Circle Dr
- 315 E Hughes St
- 217 W Hughes St
- 1027 Rebecca St Unit 14
- 1023 Rebecca St Unit 16
- 1039 Rose St
- The Redhill Paired Plan at Emerald Hills
- The Rosedale Paired Plan at Emerald Hills
- The Iris Paired Plan at Emerald Hills
- 1031 Rebecca St Unit 12
- 1037 Rebecca St Unit 9
- 1050 Rebecca St Unit 18
- 1025 Rebecca St Unit 15
- 1029 Rebecca St Unit 13
- 1048 Rebecca St Unit 19
- 1049 Rebecca St Unit 3
- 307 Locust St
- 606 Clinton St
- 402 S Madison St
- 322 S Eagle St
- 106 W Hughes St
- 113 W Hughes St
- 117 W Hughes St
- 104 W Hughes St
- 130 W Hughes St
- 121 W Hughes St
- 125 W Hughes St
- 136 W Hughes St
- 129 W Hughes St
- 120 Circle Dr
- 124 Circle Dr
- 115 E Hughes St
- 133 W Hughes St
- 140 W Hughes St
- 911 Jones St
- 1015 Lowe Dr
- 128 Circle Dr
- 1003 Jones St
- 215 E Hughes St
- 136 Circle Dr