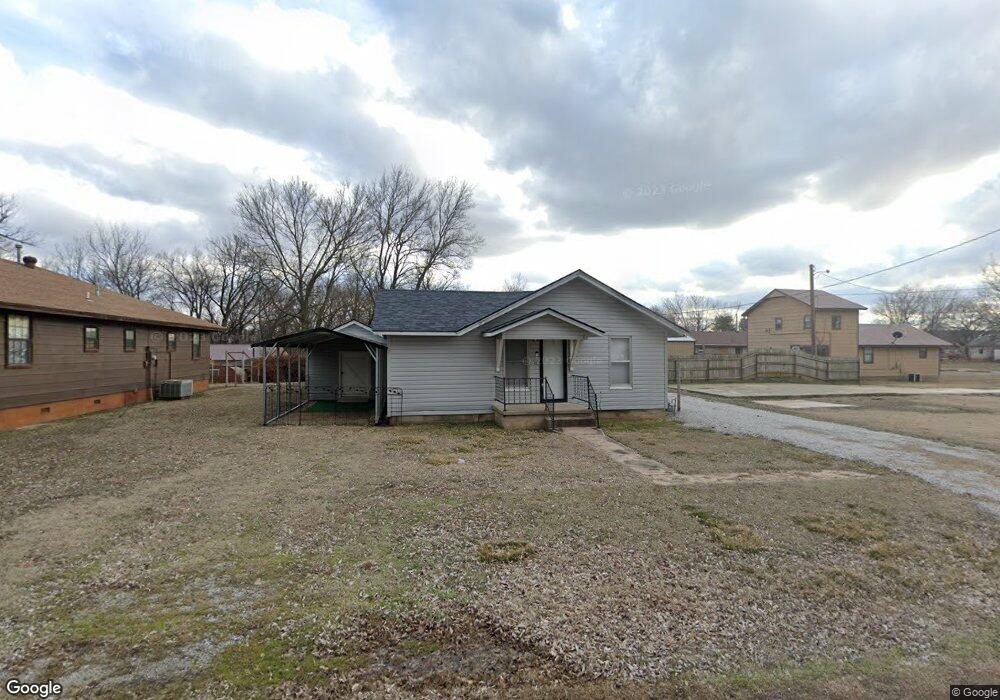
110 W Walnut Ave Barnsdall, OK 74002
Estimated Value: $53,966 - $120,000
2
Beds
1
Bath
1,001
Sq Ft
$80/Sq Ft
Est. Value
About This Home
This home is located at 110 W Walnut Ave, Barnsdall, OK 74002 and is currently estimated at $79,655, approximately $79 per square foot. 110 W Walnut Ave is a home located in Osage County with nearby schools including Barnsdall Elementary School and Barnsdall High School.
Ownership History
Date
Name
Owned For
Owner Type
Purchase Details
Closed on
May 22, 2025
Sold by
Swift Jack W and Swift Maria
Bought by
Swift Bradley
Current Estimated Value
Purchase Details
Closed on
Feb 25, 2019
Sold by
Swift Jack W and Swift Maria
Bought by
Swift Jack W and Swift Maria
Purchase Details
Closed on
Feb 25, 2011
Sold by
Fannie Mae
Bought by
Swift Jack W
Purchase Details
Closed on
Jun 21, 2010
Sold by
Rossino Louis J
Bought by
Federal National Mortgage Association
Purchase Details
Closed on
Feb 15, 2007
Sold by
Graham Dennis
Bought by
Rossino Louis J
Home Financials for this Owner
Home Financials are based on the most recent Mortgage that was taken out on this home.
Original Mortgage
$43,900
Interest Rate
6.13%
Mortgage Type
New Conventional
Purchase Details
Closed on
Jan 20, 1993
Sold by
Wilkerson Wilkerson A and Wilkerson Gladys
Bought by
Graham George W
Create a Home Valuation Report for This Property
The Home Valuation Report is an in-depth analysis detailing your home's value as well as a comparison with similar homes in the area
Purchase History
| Date | Buyer | Sale Price | Title Company |
|---|---|---|---|
| Swift Bradley | -- | None Listed On Document | |
| Swift Bradley | -- | None Listed On Document | |
| Swift Jack W | -- | None Available | |
| Swift Jack W | $23,000 | -- | |
| Federal National Mortgage Association | -- | None Availabale | |
| Rossino Louis J | -- | -- | |
| Graham George W | $10,000 | -- |
Source: Public Records
Mortgage History
| Date | Status | Borrower | Loan Amount |
|---|---|---|---|
| Previous Owner | Rossino Louis J | $43,900 |
Source: Public Records
Tax History
| Year | Tax Paid | Tax Assessment Tax Assessment Total Assessment is a certain percentage of the fair market value that is determined by local assessors to be the total taxable value of land and additions on the property. | Land | Improvement |
|---|---|---|---|---|
| 2025 | $12 | $124 | $124 | $0 |
| 2024 | $12 | $124 | $124 | $0 |
| 2023 | $12 | $3,265 | $124 | $3,141 |
| 2022 | $303 | $3,265 | $124 | $3,141 |
| 2021 | $305 | $3,265 | $124 | $3,141 |
| 2020 | $315 | $3,524 | $124 | $3,400 |
| 2019 | $322 | $3,357 | $124 | $3,233 |
| 2018 | $270 | $3,197 | $124 | $3,073 |
| 2017 | $258 | $3,045 | $124 | $2,921 |
| 2016 | $243 | $2,900 | $124 | $2,776 |
| 2015 | $230 | $2,762 | $124 | $2,638 |
| 2014 | $235 | $2,762 | $124 | $2,638 |
| 2013 | $235 | $2,762 | $124 | $2,638 |
Source: Public Records
Map
Nearby Homes
- 112 E Main St
- 3306 2401 Rd
- 7365 Cr 2420
- 22 2280
- 28 County Road 2280
- 27 County Road 2280
- 523 County Road 2280
- 164 County Road 2280
- 161 County Road 2280
- 9 County Road 2280
- 11 County Road 2280
- 219 County Road 2280
- 8 County Road 2280
- 18 County Road 2280
- 3306 County Road 2401
- 8501 Oklahoma 11
- 0000 County Road 2561
- 1569 County Road 2561
- Cox Farm
- W of Cr 2075
- 110 E Walnut Ave
- 118 E Walnut Ave
- 401 S 1st St
- 407 S 1st St
- 409 S 1st St
- 115 E Walnut Ave
- 407 1st St
- 105 E Walnut Ave
- 101 W Walnut Ave
- 415 S 1st St
- 501 S 1st St
- 116 W Chestnut Ave
- 110 E Vine Ave
- 116 E Vine Ave
- 124 E Vine Ave
- 115 W Walnut Ave
- 103 W Vine Ave
- 103 Chestnut Ave
- 108 W Walnut Ave
- 160 S 1st Rd
Your Personal Tour Guide
Ask me questions while you tour the home.