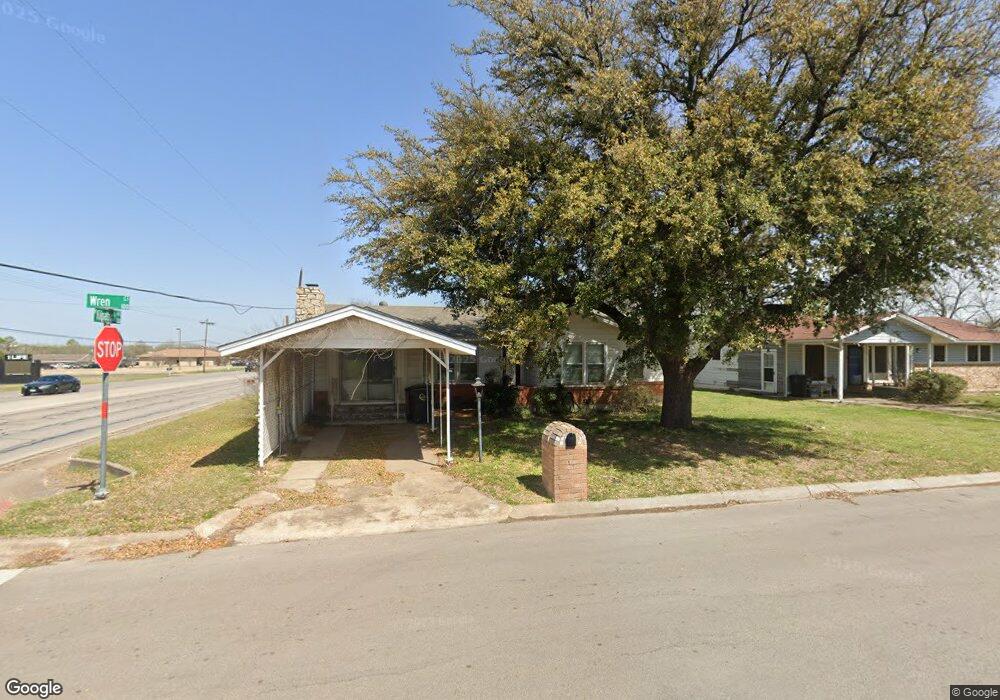
110 Wren Ct Cleburne, TX 76033
Estimated Value: $197,000 - $209,000
3
Beds
1
Bath
1,348
Sq Ft
$150/Sq Ft
Est. Value
About This Home
This home is located at 110 Wren Ct, Cleburne, TX 76033 and is currently estimated at $202,025, approximately $149 per square foot. 110 Wren Ct is a home located in Johnson County with nearby schools including Cooke Elementary School, A.D. Wheat Middle School, and Cleburne High School.
Ownership History
Date
Name
Owned For
Owner Type
Purchase Details
Closed on
Jul 20, 2012
Sold by
Secretary Of Hud
Bought by
Ward Elvis and Ward Dianna
Current Estimated Value
Home Financials for this Owner
Home Financials are based on the most recent Mortgage that was taken out on this home.
Original Mortgage
$28,950
Outstanding Balance
$4,456
Interest Rate
3.7%
Mortgage Type
New Conventional
Estimated Equity
$197,569
Purchase Details
Closed on
Oct 9, 2010
Sold by
Chandler Joy
Bought by
Bac Home Loans Servicing Lp
Purchase Details
Closed on
Oct 7, 2010
Sold by
Bac Home Loans Servicing Lp
Bought by
The Secretary Of Hud
Purchase Details
Closed on
Aug 6, 2008
Sold by
Elmore Leslie H
Bought by
Chandler Joy
Home Financials for this Owner
Home Financials are based on the most recent Mortgage that was taken out on this home.
Original Mortgage
$68,955
Interest Rate
6.38%
Mortgage Type
Purchase Money Mortgage
Create a Home Valuation Report for This Property
The Home Valuation Report is an in-depth analysis detailing your home's value as well as a comparison with similar homes in the area
Home Values in the Area
Average Home Value in this Area
Purchase History
| Date | Buyer | Sale Price | Title Company |
|---|---|---|---|
| Ward Elvis | -- | None Available | |
| Bac Home Loans Servicing Lp | $73,644 | None Available | |
| The Secretary Of Hud | -- | Lsi Title Agency Inc | |
| Chandler Joy | -- | Stnt |
Source: Public Records
Mortgage History
| Date | Status | Borrower | Loan Amount |
|---|---|---|---|
| Open | Ward Elvis | $28,950 | |
| Previous Owner | Chandler Joy | $68,955 |
Source: Public Records
Tax History Compared to Growth
Tax History
| Year | Tax Paid | Tax Assessment Tax Assessment Total Assessment is a certain percentage of the fair market value that is determined by local assessors to be the total taxable value of land and additions on the property. | Land | Improvement |
|---|---|---|---|---|
| 2025 | $3,715 | $166,603 | $30,500 | $136,103 |
| 2024 | $3,715 | $166,603 | $30,500 | $136,103 |
| 2023 | $4,497 | $202,106 | $30,500 | $171,606 |
| 2022 | $3,297 | $131,753 | $30,500 | $101,253 |
| 2021 | $3,438 | $131,753 | $30,500 | $101,253 |
| 2020 | $3,415 | $123,253 | $22,000 | $101,253 |
| 2019 | $3,642 | $123,253 | $22,000 | $101,253 |
| 2018 | $3,149 | $106,535 | $20,625 | $85,910 |
| 2017 | $2,187 | $74,283 | $20,625 | $53,658 |
| 2016 | $1,882 | $63,924 | $15,000 | $48,924 |
| 2015 | $1,615 | $63,924 | $15,000 | $48,924 |
| 2014 | $1,615 | $60,578 | $15,000 | $45,578 |
Source: Public Records
Map
Nearby Homes
- Robin Plan at Craftsman's Corner
- Cardinal Plan at Craftsman's Corner
- 433 Rose Ave
- Sherwood Plan at Craftsman's Corner
- Essex Plan at Craftsman's Corner
- Hanover Plan at Craftsman's Corner
- 426 Rose Ave
- 1911 Joslin St
- 603 Lilly St
- 640 W Kilpatrick St
- 422 Rose Ave
- 413 Rose Ave
- 414 Rose Ave
- 810 Euclid St
- 404 Rose Ave
- 905 Euclid St
- 808 Marengo St
- 1309 Manor Dr
- 805 Marengo St
- 315 Rose Ave
- 108 Wren Ct
- 711 W Kilpatrick St
- 106 Wren Ct
- 109 Wren Ct
- 709 W Kilpatrick St
- 107 Wren Ct
- 104 Wren Ct
- 105 Wren Ct
- 707 W Kilpatrick St
- 806 W Kilpatrick St
- 714 Rose Ave
- 103 Wren Ct
- 712 Rose Ave
- 705 W Kilpatrick St
- 102 Wren Ct
- 710 Rose Ave
- 1916 Starling Ct
- 1914 Starling Ct
- 101 Wren Ct
- 1908 Starling Ct Unit 1910