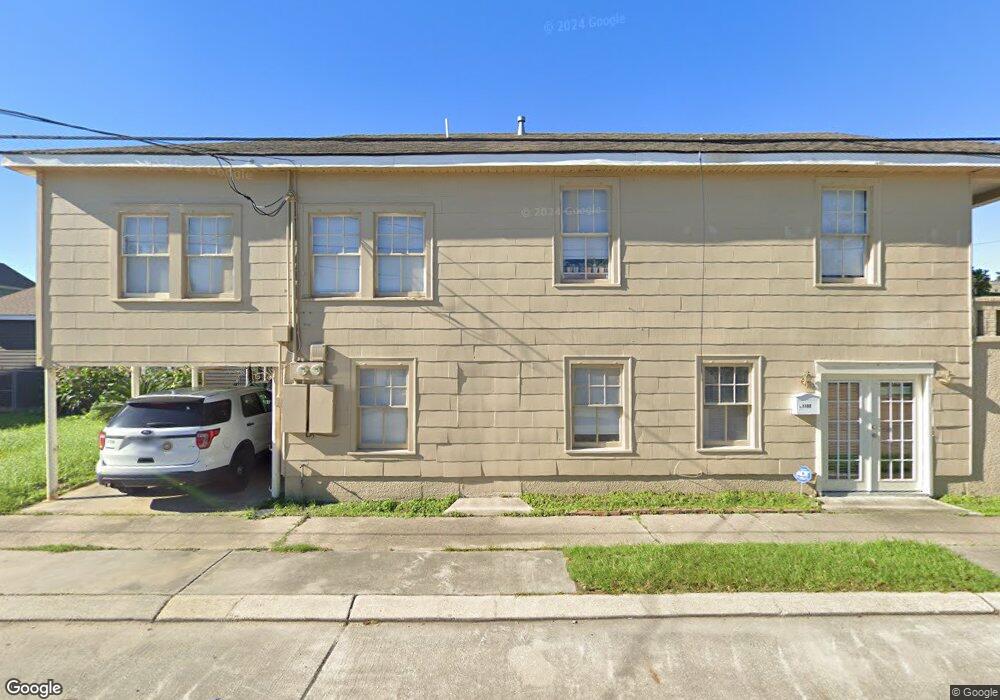
1100 9th St Gretna, LA 70053
Estimated Value: $254,000 - $436,000
--
Bed
--
Bath
--
Sq Ft
3,615
Sq Ft Lot
About This Home
This home is located at 1100 9th St, Gretna, LA 70053 and is currently estimated at $319,686. 1100 9th St is a home with nearby schools including East Meadow School, Gretna No. 2 Academy for Advanced Studies, and McDonogh 26 Elementary School.
Ownership History
Date
Name
Owned For
Owner Type
Purchase Details
Closed on
Dec 28, 2022
Sold by
Cheramie Trust
Bought by
Dabd Pira Properties Llc
Current Estimated Value
Home Financials for this Owner
Home Financials are based on the most recent Mortgage that was taken out on this home.
Original Mortgage
$325,000
Outstanding Balance
$314,967
Interest Rate
6.61%
Mortgage Type
Seller Take Back
Estimated Equity
$4,719
Purchase Details
Closed on
Mar 9, 2005
Sold by
Hernnadez Louis A J
Bought by
Cheramie Trust
Create a Home Valuation Report for This Property
The Home Valuation Report is an in-depth analysis detailing your home's value as well as a comparison with similar homes in the area
Home Values in the Area
Average Home Value in this Area
Purchase History
| Date | Buyer | Sale Price | Title Company |
|---|---|---|---|
| Dabd Pira Properties Llc | $325,000 | Crescent City Title | |
| Cheramie Trust | $100,000 | -- |
Source: Public Records
Mortgage History
| Date | Status | Borrower | Loan Amount |
|---|---|---|---|
| Open | Dabd Pira Properties Llc | $325,000 |
Source: Public Records
Tax History Compared to Growth
Tax History
| Year | Tax Paid | Tax Assessment Tax Assessment Total Assessment is a certain percentage of the fair market value that is determined by local assessors to be the total taxable value of land and additions on the property. | Land | Improvement |
|---|---|---|---|---|
| 2024 | $1,641 | $30,870 | $2,960 | $27,910 |
| 2023 | $4,413 | $30,870 | $2,960 | $27,910 |
| 2022 | $1,507 | $10,540 | $2,960 | $7,580 |
| 2021 | $1,433 | $10,540 | $2,960 | $7,580 |
| 2020 | $1,424 | $10,540 | $2,960 | $7,580 |
| 2019 | $1,446 | $10,540 | $2,960 | $7,580 |
| 2018 | $723 | $10,540 | $2,960 | $7,580 |
| 2017 | $1,227 | $10,540 | $2,960 | $7,580 |
| 2016 | $1,205 | $10,540 | $2,960 | $7,580 |
| 2015 | $667 | $10,340 | $2,960 | $7,380 |
| 2014 | $667 | $10,340 | $2,960 | $7,380 |
Source: Public Records
Map
Nearby Homes