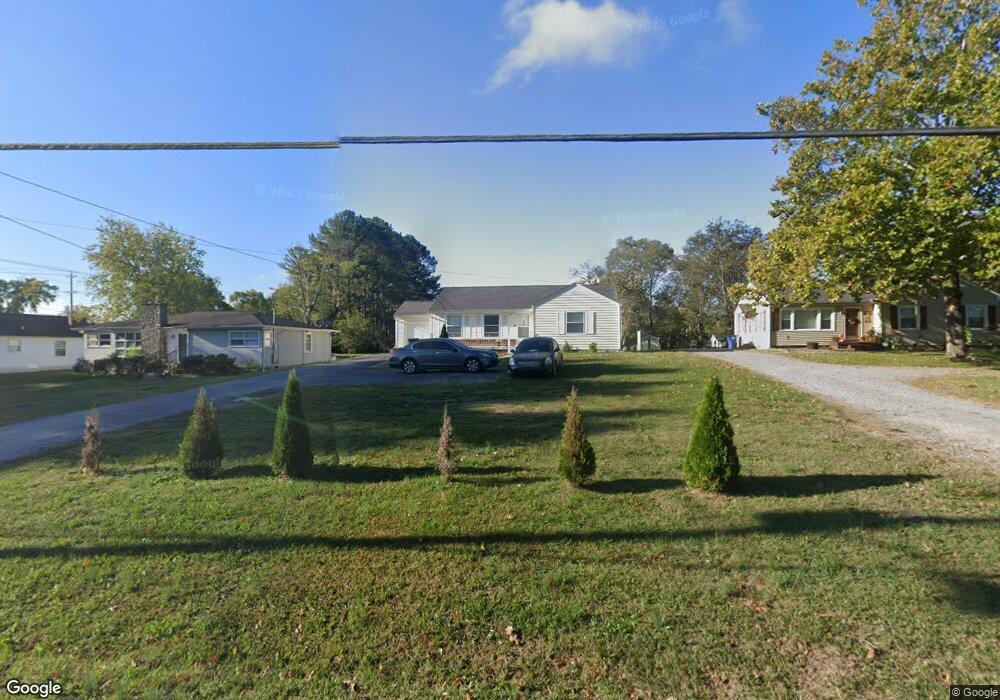
1100 Belmont Ave Shelbyville, TN 37160
Estimated Value: $192,089 - $227,000
--
Bed
1
Bath
1,350
Sq Ft
$157/Sq Ft
Est. Value
About This Home
This home is located at 1100 Belmont Ave, Shelbyville, TN 37160 and is currently estimated at $212,272, approximately $157 per square foot. 1100 Belmont Ave is a home located in Bedford County with nearby schools including East Side Elementary School, Harris Middle School, and Shelbyville Central High School.
Ownership History
Date
Name
Owned For
Owner Type
Purchase Details
Closed on
Jul 17, 2019
Sold by
Meek Samuel and Meek Annette
Bought by
Moreno Mario A Olivera
Current Estimated Value
Home Financials for this Owner
Home Financials are based on the most recent Mortgage that was taken out on this home.
Original Mortgage
$98,400
Outstanding Balance
$86,022
Interest Rate
3.82%
Mortgage Type
New Conventional
Estimated Equity
$126,250
Purchase Details
Closed on
Jul 29, 2015
Sold by
Parsons Ellen M
Bought by
Meek Samuel and Meek Annette
Home Financials for this Owner
Home Financials are based on the most recent Mortgage that was taken out on this home.
Original Mortgage
$76,000
Interest Rate
4.11%
Mortgage Type
New Conventional
Purchase Details
Closed on
Oct 13, 1959
Bought by
Parsons Harry A and Parsons Ellen M
Create a Home Valuation Report for This Property
The Home Valuation Report is an in-depth analysis detailing your home's value as well as a comparison with similar homes in the area
Home Values in the Area
Average Home Value in this Area
Purchase History
| Date | Buyer | Sale Price | Title Company |
|---|---|---|---|
| Moreno Mario A Olivera | $123,000 | None Available | |
| Meek Samuel | $76,000 | -- | |
| Parsons Harry A | -- | -- |
Source: Public Records
Mortgage History
| Date | Status | Borrower | Loan Amount |
|---|---|---|---|
| Open | Moreno Mario A Olivera | $98,400 | |
| Previous Owner | Meek Samuel | $76,000 |
Source: Public Records
Tax History Compared to Growth
Tax History
| Year | Tax Paid | Tax Assessment Tax Assessment Total Assessment is a certain percentage of the fair market value that is determined by local assessors to be the total taxable value of land and additions on the property. | Land | Improvement |
|---|---|---|---|---|
| 2025 | -- | $31,425 | $0 | $0 |
| 2024 | -- | $31,425 | $5,400 | $26,025 |
| 2023 | $1,196 | $31,425 | $5,400 | $26,025 |
| 2022 | $1,231 | $31,425 | $5,400 | $26,025 |
| 2021 | $1,118 | $31,425 | $5,400 | $26,025 |
| 2020 | $826 | $31,425 | $5,400 | $26,025 |
| 2019 | $826 | $18,650 | $2,875 | $15,775 |
| 2018 | $807 | $18,650 | $2,875 | $15,775 |
| 2017 | $807 | $18,650 | $2,875 | $15,775 |
| 2016 | $800 | $18,650 | $2,875 | $15,775 |
| 2015 | $800 | $18,650 | $2,875 | $15,775 |
| 2014 | $784 | $19,997 | $0 | $0 |
Source: Public Records
Map
Nearby Homes
- 102 Germantown Rd
- 215 Coney Island Rd
- 211 S Fairoak St
- 709 Belmont Ave
- 112 Elizabeth St
- 120 Dogwood Ct
- 222 Carter St
- 314 Maplewood Dr
- 220 Walnut St
- 207 Martha St
- 107 Rockwood Dr
- 0 E Depot St
- 627 E Lane St
- 631 E Lane St
- 464 Whitthorne St
- 1024 Tennessee 64
- 1413 Highway 130 E
- 527 Deery St
- 128 Riverlake Rd
- 713 King Ave
- 1102 Belmont Ave
- 1012 Belmont Ave
- 1010 Belmont Ave
- 1104 Belmont Ave
- 1008A Belmont Ave
- 1008 Belmont Ave
- 100 Cliffside Ave
- 1101 Belmont Ave
- 919 Woodland Ave
- 1103 Belmont Ave
- 1108 Belmont Ave
- 1013 Belmont Ave
- 917 Woodland Ave
- 1105 Belmont Ave
- 102 Cliffside Ave
- 921 Woodland Ave
- 923 Woodland Ave
- 1107 Belmont Ave
- 915 Woodland Ave
- 905 Woodland Ave