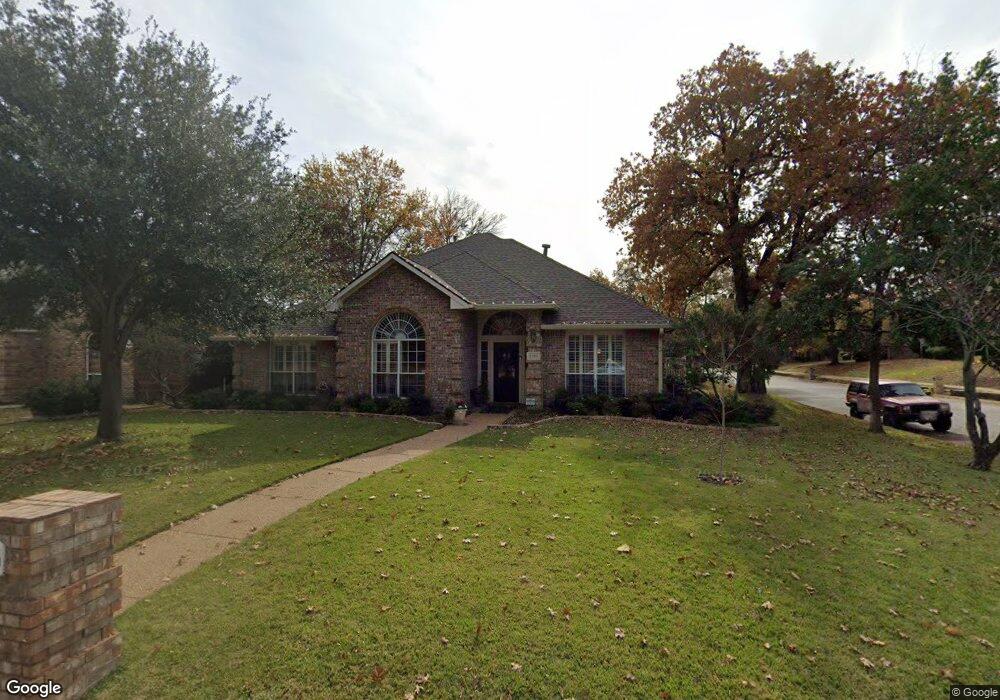
1100 Chapel Dr Denton, TX 76205
South Denton NeighborhoodEstimated Value: $448,000 - $475,000
4
Beds
2
Baths
2,199
Sq Ft
$210/Sq Ft
Est. Value
About This Home
This home is located at 1100 Chapel Dr, Denton, TX 76205 and is currently estimated at $461,484, approximately $209 per square foot. 1100 Chapel Dr is a home located in Denton County with nearby schools including Houston Elementary School, McMath Middle School, and Denton High School.
Ownership History
Date
Name
Owned For
Owner Type
Purchase Details
Closed on
Sep 6, 2019
Sold by
Moore John B and Moore Regina
Bought by
Popejoy Kristyn Marie and Wrigley David Randall
Current Estimated Value
Home Financials for this Owner
Home Financials are based on the most recent Mortgage that was taken out on this home.
Original Mortgage
$219,450
Outstanding Balance
$192,614
Interest Rate
3.7%
Mortgage Type
New Conventional
Estimated Equity
$268,870
Purchase Details
Closed on
Oct 26, 1995
Sold by
Braden Stephen J and Braden Robin L
Bought by
Enfinger Steve T and Enfinger Sandra Wilson
Home Financials for this Owner
Home Financials are based on the most recent Mortgage that was taken out on this home.
Original Mortgage
$142,500
Interest Rate
7.6%
Purchase Details
Closed on
Aug 2, 1994
Sold by
Chambers & Shafer Inc
Bought by
Braden Stephen J and Braden Robin L
Home Financials for this Owner
Home Financials are based on the most recent Mortgage that was taken out on this home.
Original Mortgage
$126,350
Interest Rate
8.51%
Create a Home Valuation Report for This Property
The Home Valuation Report is an in-depth analysis detailing your home's value as well as a comparison with similar homes in the area
Home Values in the Area
Average Home Value in this Area
Purchase History
| Date | Buyer | Sale Price | Title Company |
|---|---|---|---|
| Popejoy Kristyn Marie | -- | Lawyers Title | |
| Enfinger Steve T | -- | -- | |
| Braden Stephen J | -- | -- |
Source: Public Records
Mortgage History
| Date | Status | Borrower | Loan Amount |
|---|---|---|---|
| Open | Popejoy Kristyn Marie | $219,450 | |
| Previous Owner | Enfinger Steve T | $142,500 | |
| Previous Owner | Braden Stephen J | $126,350 |
Source: Public Records
Tax History Compared to Growth
Tax History
| Year | Tax Paid | Tax Assessment Tax Assessment Total Assessment is a certain percentage of the fair market value that is determined by local assessors to be the total taxable value of land and additions on the property. | Land | Improvement |
|---|---|---|---|---|
| 2025 | $7,443 | $477,000 | $85,094 | $391,906 |
| 2024 | $8,639 | $447,547 | $0 | $0 |
| 2023 | $6,572 | $406,861 | $85,094 | $394,147 |
| 2022 | $7,852 | $369,874 | $75,083 | $331,643 |
| 2021 | $7,475 | $336,249 | $50,055 | $286,194 |
| 2020 | $7,102 | $310,728 | $50,055 | $260,673 |
| 2019 | $7,426 | $311,239 | $50,055 | $261,184 |
| 2018 | $7,150 | $296,002 | $50,055 | $245,947 |
| 2017 | $6,658 | $269,382 | $50,055 | $221,424 |
| 2016 | $4,567 | $244,893 | $50,055 | $194,838 |
| 2015 | $3,310 | $229,629 | $50,055 | $179,574 |
| 2014 | $3,310 | $180,000 | $32,536 | $147,464 |
| 2013 | -- | $168,000 | $29,032 | $138,968 |
Source: Public Records
Map
Nearby Homes
- 1012 Indian Ridge Dr
- 1108 Ellison Park Cir
- 916 Smokerise Cir
- 720 Smokerise Cir
- 816 Chapel Dr
- 1000 Lynhurst Ln
- 824 Sandpiper Dr
- 821 Sandpiper Dr
- 829 Skylark Dr
- 2226 Savannah Trail
- 2216 Jefferson Trail
- 2000 Lamprey Cir
- 2009 Lake Fork Ct
- 924 Ridgecrest Cir
- 2253 Hollyhill Ln
- 2272 Hollyhill Ln
- 2012 Hollyhill Ln
- 2209 Loon Lake Rd
- 2218 Southridge Dr
- 2312 Caddo Cir
- 1104 Chapel Dr
- 1101 Bishops Park St
- 1108 Chapel Dr
- 1105 Bishops Park St
- 1100 Pennsylvania Dr
- 1101 Chapel Dr
- 1104 Pennsylvania Dr
- 1105 Chapel Dr
- 1109 Bishops Park St
- 1108 Pennsylvania Dr
- 1009 Chapel Dr
- 1109 Chapel Dr
- 1112 Pennsylvania Dr
- 1005 Chapel Dr
- 1113 Bishops Park St
- 1100 Sandpiper Dr
- 1104 Sandpiper Dr
- 1101 Hope St
- 1100 Bishops Park St
- 1200 Pennsylvania Dr