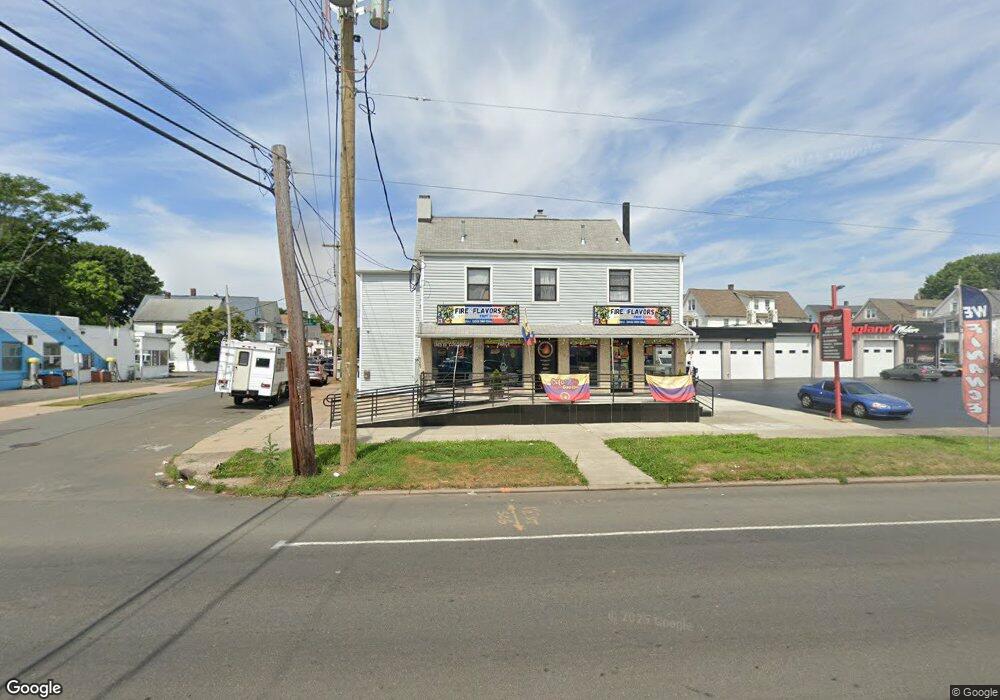
1100 Dixwell Ave Hamden, CT 06514
Studio
--
Bath
5,204
Sq Ft
8,276
Sq Ft
About This Home
This home is located at 1100 Dixwell Ave, Hamden, CT 06514. 1100 Dixwell Ave is a home located in New Haven County with nearby schools including Church Street School, Hamden Middle School, and Hamden High School.
Ownership History
Date
Name
Owned For
Owner Type
Purchase Details
Closed on
Jun 8, 2016
Sold by
Daniel Slater Ret
Bought by
Pinguil Angel and Guallpa Maria
Purchase Details
Closed on
Jun 20, 2014
Sold by
Webster Bank and Dianiel Slater Ret
Bought by
Daniel Sister Ret and Webster Bank
Home Financials for this Owner
Home Financials are based on the most recent Mortgage that was taken out on this home.
Original Mortgage
$100,000
Interest Rate
4.21%
Mortgage Type
Commercial
Purchase Details
Closed on
Oct 9, 1984
Bought by
Webster Bank
Create a Home Valuation Report for This Property
The Home Valuation Report is an in-depth analysis detailing your home's value as well as a comparison with similar homes in the area
Home Values in the Area
Average Home Value in this Area
Purchase History
| Date | Buyer | Sale Price | Title Company |
|---|---|---|---|
| Pinguil Angel | -- | -- | |
| Pinguil Angel | -- | -- | |
| Daniel Sister Ret | -- | -- | |
| Daniel Sister Ret | -- | -- | |
| Webster Bank | -- | -- |
Source: Public Records
Mortgage History
| Date | Status | Borrower | Loan Amount |
|---|---|---|---|
| Previous Owner | Webster Bank | $100,000 |
Source: Public Records
Tax History
| Year | Tax Paid | Tax Assessment Tax Assessment Total Assessment is a certain percentage of the fair market value that is determined by local assessors to be the total taxable value of land and additions on the property. | Land | Improvement |
|---|---|---|---|---|
| 2025 | $24,735 | $476,770 | $127,400 | $349,370 |
| 2024 | $20,670 | $371,700 | $83,860 | $287,840 |
| 2023 | $18,482 | $327,810 | $83,860 | $243,950 |
| 2022 | $18,187 | $327,810 | $83,860 | $243,950 |
| 2021 | $17,190 | $327,810 | $83,860 | $243,950 |
| 2020 | $11,844 | $227,850 | $76,930 | $150,920 |
| 2019 | $11,133 | $227,850 | $76,930 | $150,920 |
| 2018 | $10,928 | $227,850 | $76,930 | $150,920 |
| 2017 | $10,312 | $227,850 | $76,930 | $150,920 |
| 2016 | $10,335 | $227,850 | $76,930 | $150,920 |
| 2015 | $9,312 | $227,850 | $76,930 | $150,920 |
| 2014 | $9,098 | $227,850 | $76,930 | $150,920 |
Source: Public Records
Map
Nearby Homes
- 26 4th St
- 84 2nd St
- 23 Notkins St
- 115 3rd St
- 22 Helen St
- 59 Pine St
- 82 Helen St
- 63 Gorham Ave
- 32 Sunset Rd
- 634 Newhall St
- 89 Glenbrook Ave
- 48 Rockwood Rd
- 48 Alling St
- 25 Rockwood Rd
- 255 Pine Rock Ave Unit 8
- 304 Pine Rock Ave Unit C2
- 118 Cherry Ann St
- 1412 Dixwell Ave
- 773 Dixwell Ave
- 1422 Dixwell Ave
Your Personal Tour Guide
Ask me questions while you tour the home.