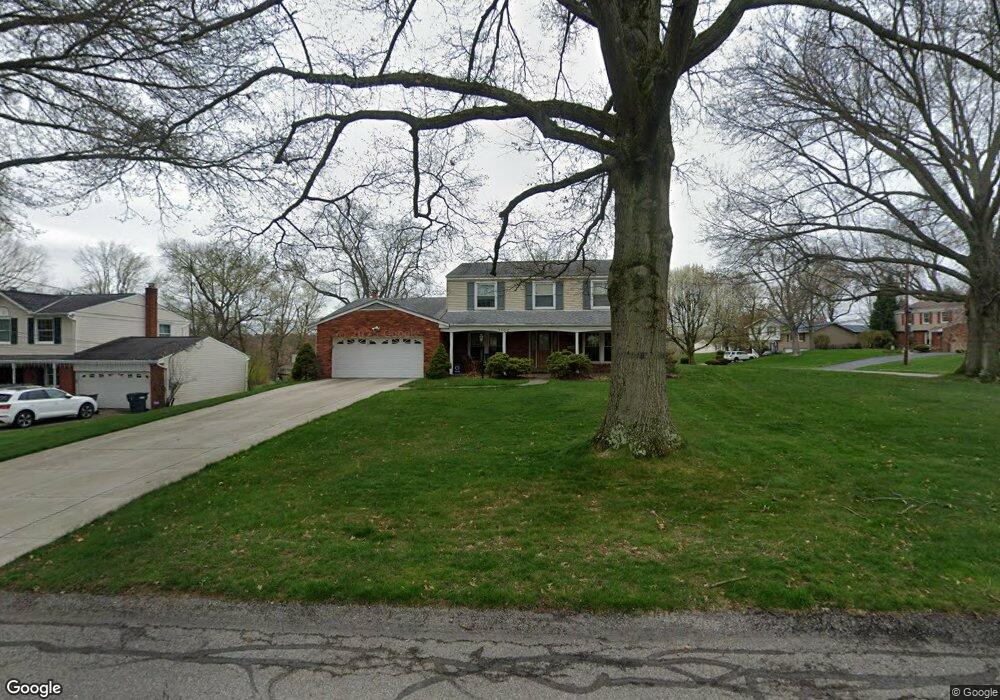
1100 Galaxy Cir Pittsburgh, PA 15241
Estimated Value: $409,183 - $487,000
4
Beds
3
Baths
1,956
Sq Ft
$229/Sq Ft
Est. Value
About This Home
This home is located at 1100 Galaxy Cir, Pittsburgh, PA 15241 and is currently estimated at $447,046, approximately $228 per square foot. 1100 Galaxy Cir is a home located in Allegheny County with nearby schools including Upper St. Clair High School and Ave Maria Academy - Bethel Park Campus.
Ownership History
Date
Name
Owned For
Owner Type
Purchase Details
Closed on
Oct 17, 2022
Sold by
Welch Julie B and Welch Michael A
Bought by
Welch Julie B
Current Estimated Value
Purchase Details
Closed on
Sep 23, 2022
Sold by
Welch Michael A and Welch Julie B
Bought by
Welch Julie B
Purchase Details
Closed on
Aug 30, 2006
Sold by
Diora Vithal G
Bought by
Welch Michael A
Home Financials for this Owner
Home Financials are based on the most recent Mortgage that was taken out on this home.
Original Mortgage
$172,800
Interest Rate
6.79%
Mortgage Type
New Conventional
Purchase Details
Closed on
Jun 25, 1997
Sold by
Papageorgiou Gus and Papageorgiou Patricia L
Bought by
Diora Vithal G and Diora Dipti V
Purchase Details
Closed on
Aug 22, 1994
Sold by
Almquist Harold T and Almquist Wilma T
Bought by
Papageorgiou Gus
Create a Home Valuation Report for This Property
The Home Valuation Report is an in-depth analysis detailing your home's value as well as a comparison with similar homes in the area
Home Values in the Area
Average Home Value in this Area
Purchase History
| Date | Buyer | Sale Price | Title Company |
|---|---|---|---|
| Welch Julie B | -- | -- | |
| Welch Julie B | $1 | -- | |
| Welch Michael A | $216,000 | -- | |
| Diora Vithal G | $146,500 | -- | |
| Papageorgiou Gus | $148,000 | -- | |
| Welch Julie B | -- | -- |
Source: Public Records
Mortgage History
| Date | Status | Borrower | Loan Amount |
|---|---|---|---|
| Previous Owner | Welch Michael A | $172,800 |
Source: Public Records
Tax History Compared to Growth
Tax History
| Year | Tax Paid | Tax Assessment Tax Assessment Total Assessment is a certain percentage of the fair market value that is determined by local assessors to be the total taxable value of land and additions on the property. | Land | Improvement |
|---|---|---|---|---|
| 2025 | $7,329 | $191,900 | $40,000 | $151,900 |
| 2024 | $7,329 | $191,900 | $40,000 | $151,900 |
| 2023 | $7,124 | $191,900 | $40,000 | $151,900 |
| 2022 | $6,954 | $191,900 | $40,000 | $151,900 |
| 2021 | $908 | $191,900 | $40,000 | $151,900 |
| 2020 | $6,705 | $191,900 | $40,000 | $151,900 |
| 2019 | $6,605 | $191,900 | $40,000 | $151,900 |
| 2018 | $908 | $191,900 | $40,000 | $151,900 |
| 2017 | $6,312 | $191,900 | $40,000 | $151,900 |
| 2016 | $908 | $191,900 | $40,000 | $151,900 |
| 2015 | $908 | $191,900 | $40,000 | $151,900 |
| 2014 | $5,903 | $191,900 | $40,000 | $151,900 |
Source: Public Records
Map
Nearby Homes
- 250 Portman Ln Unit A
- 1331 Morrow Rd
- 1435 Morrow Rd
- 1560 Mayview Rd
- 1005 Tall Trees Dr
- 1109 Bank St
- 1251 Greystone Dr
- 412 Winfield St
- 2370 Morrow Rd
- 1051 Grandview Ave
- 1005 Lakemont Dr
- 2301 Southampton Dr
- 100 Pinewood Dr
- 2013 Ashton Row
- 2122 Westcott Ln
- 1115 Sray Ln
- 2350 Morrow Rd
- Ashby Plan at Hastings - Single Family
- Royston Plan at Hastings - Single Family
- Corby Plan at Hastings - Single Family
- 1118 Galaxy Cir
- 1170 Galaxy Cir
- 1182 Galaxy Cir
- 1162 Galaxy Cir
- 1177 Galaxy Cir
- 1173 Galaxy Cir
- 1126 Galaxy Cir
- 1117 Galaxy Cir
- 1181 Galaxy Cir
- 1169 Galaxy Cir
- 1121 Galaxy Cir
- 1158 Galaxy Cir
- 1165 Galaxy Cir
- 1134 Galaxy Cir
- 1185 Galaxy Cir
- 1190 Galaxy Cir
- 1125 Galaxy Cir
- 1430 Mayview Rd
- 1189 Galaxy Cir
- 1170 Southwick Dr