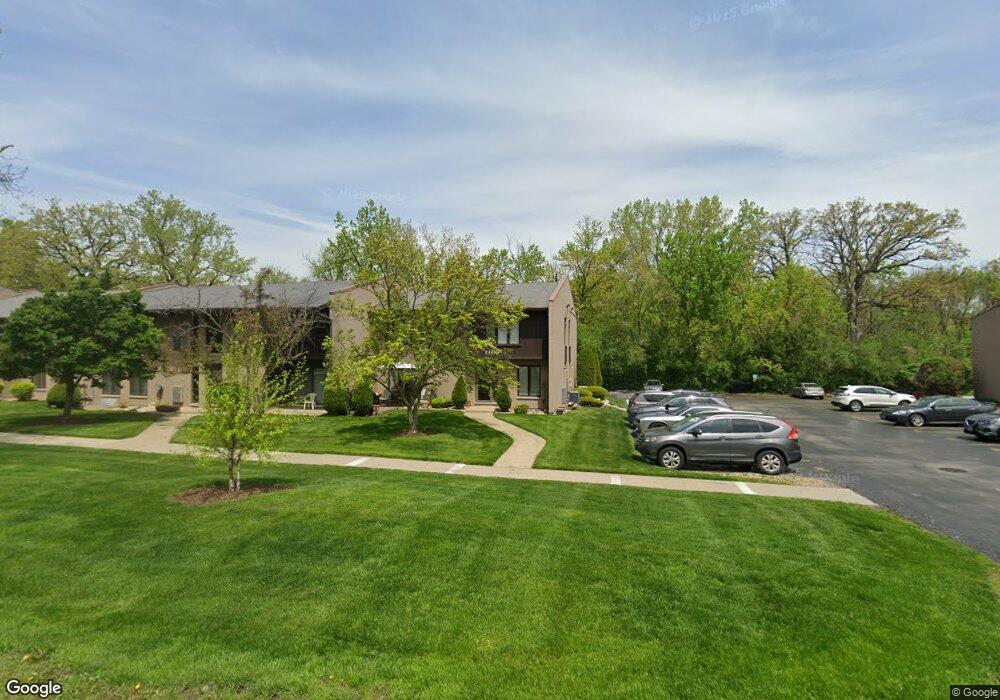
1100 Holbrook Rd Unit 3N4 Homewood, IL 60430
Estimated Value: $135,000 - $158,713
2
Beds
1
Bath
1,000
Sq Ft
$148/Sq Ft
Est. Value
About This Home
This home is located at 1100 Holbrook Rd Unit 3N4, Homewood, IL 60430 and is currently estimated at $148,178, approximately $148 per square foot. 1100 Holbrook Rd Unit 3N4 is a home located in Cook County with nearby schools including Willow Elementary School, Winston Churchill School, and James Hart School.
Ownership History
Date
Name
Owned For
Owner Type
Purchase Details
Closed on
Apr 27, 2023
Sold by
Swoam Enterprises Llc
Bought by
Sawyer Ava
Current Estimated Value
Home Financials for this Owner
Home Financials are based on the most recent Mortgage that was taken out on this home.
Original Mortgage
$5,796
Interest Rate
6.6%
Mortgage Type
Unknown
Purchase Details
Closed on
Jan 20, 2023
Sold by
Spence Kassandra and Thomas Jay
Bought by
Swoam Enterprises Llc and Cf Greer Enterprise Llc
Purchase Details
Closed on
Feb 16, 2001
Sold by
Jacobs Karel and Corlascio Kay
Bought by
Spence Kassandra and Spence Patrick Ryan
Purchase Details
Closed on
Jan 31, 2001
Sold by
Saylor Karen
Bought by
Spence Kassandra and Spence Patrick Ryan
Purchase Details
Closed on
Jan 30, 2001
Sold by
Teasdale Kristi and Jacobs Karel
Bought by
Spence Kassandra and Spence Patrick Ryan
Create a Home Valuation Report for This Property
The Home Valuation Report is an in-depth analysis detailing your home's value as well as a comparison with similar homes in the area
Home Values in the Area
Average Home Value in this Area
Purchase History
| Date | Buyer | Sale Price | Title Company |
|---|---|---|---|
| Sawyer Ava | $145,000 | Fidelity National Title Compan | |
| Swoam Enterprises Llc | $51,500 | None Listed On Document | |
| Spence Kassandra | $51,500 | -- | |
| Spence Kassandra | -- | -- | |
| Spence Kassandra | -- | -- |
Source: Public Records
Mortgage History
| Date | Status | Borrower | Loan Amount |
|---|---|---|---|
| Closed | Sawyer Ava | $5,796 | |
| Open | Sawyer Ava | $140,553 |
Source: Public Records
Tax History Compared to Growth
Tax History
| Year | Tax Paid | Tax Assessment Tax Assessment Total Assessment is a certain percentage of the fair market value that is determined by local assessors to be the total taxable value of land and additions on the property. | Land | Improvement |
|---|---|---|---|---|
| 2024 | $2,516 | $9,405 | $953 | $8,452 |
| 2023 | $1,113 | $9,405 | $953 | $8,452 |
| 2022 | $1,113 | $5,573 | $900 | $4,673 |
| 2021 | $1,081 | $5,571 | $899 | $4,672 |
| 2020 | $1,157 | $5,571 | $899 | $4,672 |
| 2019 | $997 | $5,482 | $847 | $4,635 |
| 2018 | $1,396 | $6,407 | $847 | $5,560 |
| 2017 | $1,428 | $6,407 | $847 | $5,560 |
| 2016 | $1,121 | $4,822 | $794 | $4,028 |
| 2015 | $1,053 | $4,822 | $794 | $4,028 |
| 2014 | $1,058 | $4,822 | $794 | $4,028 |
| 2013 | $1,789 | $6,770 | $794 | $5,976 |
Source: Public Records
Map
Nearby Homes
- 1100 Holbrook Rd Unit D
- 19126 Pierce Ave
- 940 Holbrook Rd Unit 33B
- 940 Holbrook Rd Unit 8A
- 110 Judith Ln
- 90 Peyton Dr
- 1308 191st St
- 55 E Craig Dr
- 163 W Raye Dr
- 223 Lynn Ln
- 817 194th St
- 176 N Floyd Ln
- 172 N Floyd Ln
- 171 Frederick Dr
- 162 Frederick Dr
- 220 W Raye Dr
- 126 N Floyd Ln
- 18849 Jamie Ct
- 159 Pleasant Dr
- 273 Charles St
- 1100 Holbrook Rd Unit 3S4
- 1100 Holbrook Rd Unit 3S9
- 1100 Holbrook Rd Unit 3S10
- 1100 Holbrook Rd Unit 3S3
- 1100 Holbrook Rd Unit 3N10
- 1100 Holbrook Rd Unit 3S7
- 1100 Holbrook Rd Unit 3N5
- 1100 Holbrook Rd Unit 2S7
- 1100 Holbrook Rd Unit 3N7
- 1100 Holbrook Rd Unit 3N3
- 1100 Holbrook Rd Unit 3N1
- 1100 Holbrook Rd Unit 3N6
- 1100 Holbrook Rd Unit 3N9
- 1100 Holbrook Rd Unit 3S2
- 1100 Holbrook Rd Unit 3N8
- 1100 Holbrook Rd Unit 3S8
- 1100 Holbrook Rd Unit 3S1
- 1100 Holbrook Rd Unit 3N2
- 1100 Holbrook Rd Unit 3S6
- 1100 Holbrook Rd Unit 3S5