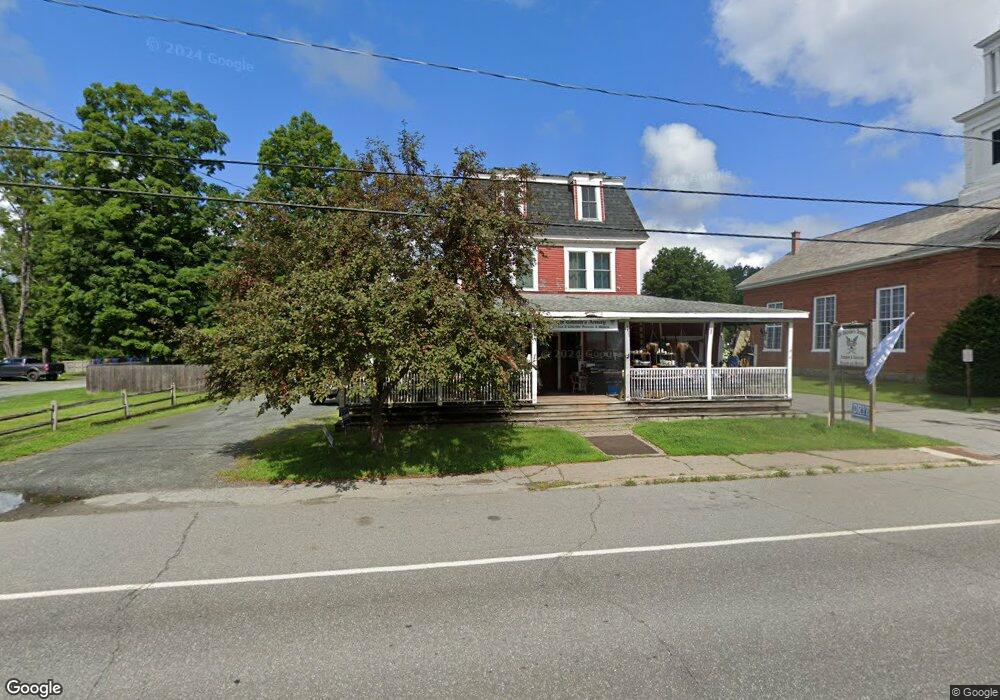
1100 Route 12a Plainfield, NH 03781
Estimated Value: $496,081
3
Beds
3
Baths
5,078
Sq Ft
$98/Sq Ft
Est. Value
About This Home
This home is located at 1100 Route 12a, Plainfield, NH 03781 and is currently estimated at $496,081, approximately $97 per square foot. 1100 Route 12a is a home located in Sullivan County with nearby schools including Plainfield Elementary School, Lebanon High School, and Estabrook Christian School.
Ownership History
Date
Name
Owned For
Owner Type
Purchase Details
Closed on
Sep 6, 2018
Sold by
Yates Paul
Bought by
Masha L Davidson Ret
Current Estimated Value
Home Financials for this Owner
Home Financials are based on the most recent Mortgage that was taken out on this home.
Original Mortgage
$220,000
Outstanding Balance
$191,458
Interest Rate
4.5%
Mortgage Type
New Conventional
Estimated Equity
$304,623
Purchase Details
Closed on
Apr 26, 2013
Sold by
Ellen M Oberkotter T and Oberkotter Ellen M
Bought by
Yates Erin and Yates Paul
Purchase Details
Closed on
Apr 16, 2001
Sold by
Sunrise Hill Enter At
Bought by
May I Be Of Service Ll
Home Financials for this Owner
Home Financials are based on the most recent Mortgage that was taken out on this home.
Original Mortgage
$393,694
Interest Rate
6.97%
Mortgage Type
Commercial
Create a Home Valuation Report for This Property
The Home Valuation Report is an in-depth analysis detailing your home's value as well as a comparison with similar homes in the area
Home Values in the Area
Average Home Value in this Area
Purchase History
| Date | Buyer | Sale Price | Title Company |
|---|---|---|---|
| Masha L Davidson Ret | $267,000 | -- | |
| Masha L Davidson Ret | $267,000 | -- | |
| Yates Erin | $130,000 | -- | |
| Yates Erin | $130,000 | -- | |
| May I Be Of Service Ll | $324,300 | -- | |
| May I Be Of Service Ll | $324,300 | -- |
Source: Public Records
Mortgage History
| Date | Status | Borrower | Loan Amount |
|---|---|---|---|
| Open | Masha L Davidson Ret | $220,000 | |
| Closed | Masha L Davidson Ret | $220,000 | |
| Previous Owner | May I Be Of Service Ll | $393,694 | |
| Closed | May I Be Of Service Ll | $0 |
Source: Public Records
Tax History
| Year | Tax Paid | Tax Assessment Tax Assessment Total Assessment is a certain percentage of the fair market value that is determined by local assessors to be the total taxable value of land and additions on the property. | Land | Improvement |
|---|---|---|---|---|
| 2023 | $6,042 | $383,600 | $127,000 | $256,600 |
| 2022 | $8,451 | $339,400 | $73,200 | $266,200 |
| 2021 | $9,011 | $339,400 | $73,200 | $266,200 |
| 2020 | $8,621 | $339,400 | $73,200 | $266,200 |
| 2019 | $8,824 | $339,400 | $73,200 | $266,200 |
| 2018 | $8,638 | $339,400 | $73,200 | $266,200 |
| 2017 | $8,485 | $306,500 | $58,300 | $248,200 |
| 2016 | $8,689 | $306,500 | $58,300 | $248,200 |
| 2015 | $8,352 | $306,500 | $58,300 | $248,200 |
| 2014 | $8,418 | $306,100 | $58,300 | $247,800 |
| 2013 | $4,579 | $166,500 | $38,900 | $127,600 |
Source: Public Records
Map
Nearby Homes
- 1106 Route 12a
- 19 Spruce Park Dr
- 1507 New Hampshire 12a
- 00 Barber Ln
- 1041 Stage Rd
- 56 Mount Hunger Rd
- 14 Summarsell Dr Unit 16
- 89 Route 12
- 223 Taylor Dr
- 22 King Dr
- 49 Clay Hill Rd
- 94 Porter Rd
- 763 Center Rd
- 00 Willow Brook Rd Unit 5
- 282 Skunk Hollow Rd
- 528 Town House Rd
- 0 Town House Rd Unit 28
- 25 Independent Dr
- 8 Laclair Dr
- 8 Grout Rd
- 1097 Route 12a
- 1103 Route 12a
- 1132 Route 12a
- 1111 Route 12a
- 1108 Route 12a
- 13 Peterson Rd
- 1089 Route 12a
- 2 Daniels Rd
- 9 Peterson Rd
- 1120 Route 12a
- 1092 Route 12a
- 1120 New Hampshire 12a
- 1093 Route 12a
- 1 Daniels Rd
- 23 Peterson Rd
- 1078 Route 12a
- 1130 New Hampshire 12a
- 21 Lawton Ln
- 8 Daniels Rd
- 1121 Route 12a
Your Personal Tour Guide
Ask me questions while you tour the home.