
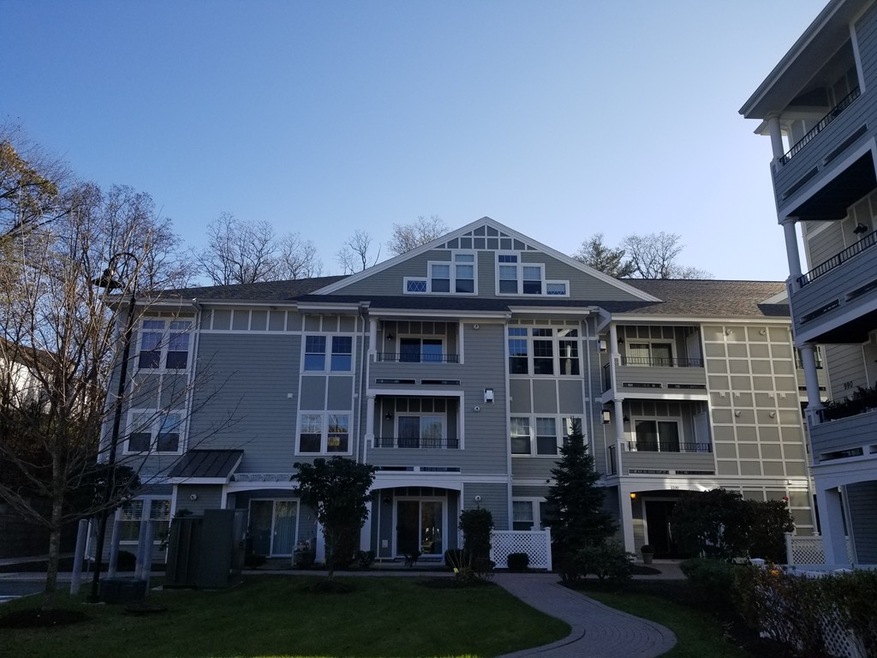
1100 Vfw Pkwy Unit 201 West Roxbury, MA 02132
West Roxbury Neighborhood
2
Beds
2
Baths
1,085
Sq Ft
1,089
Sq Ft Lot
About This Home
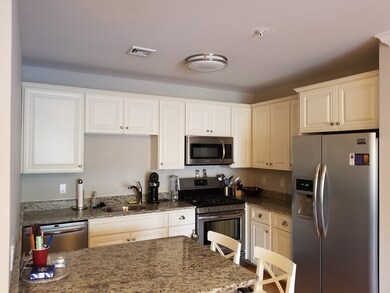
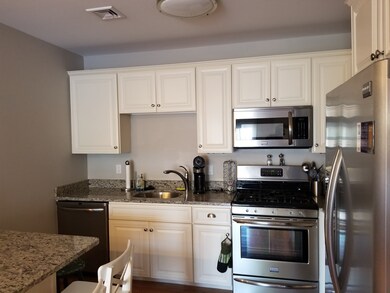
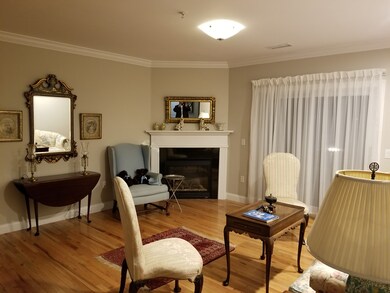
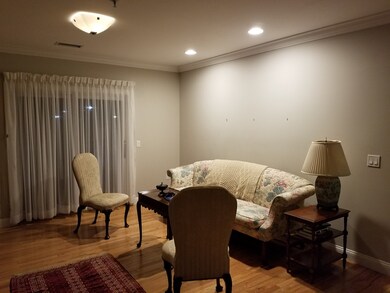
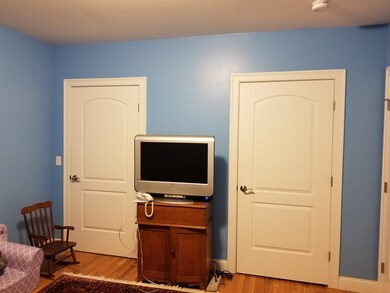
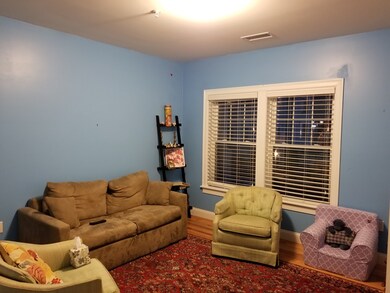
As of August 2019Turnkey condo in excellent convenient location with easy access to shopping, highways and Millennium Park. Newer construction- the complex was completed in 2011 so everything is up to date. Bright white kitchen with stainless steel appliances, granite counter tops & breakfast bar. Spacious living room with gas fireplace, hardwood floors and sliders to private balcony. 2 spacious bedrooms and 1 1/2 modern ceramic tile baths. In unit laundry. 2 parking spaces and ample guest parking. High owner occupancy. Beautifully landscaped grounds. This complex is professionally managed and very well maintained. High owner occupancy.
Property Details
Home Type
Condominium
Est. Annual Taxes
$6,661
Year Built
2011
Lot Details
0
Listing Details
- Unit Level: 2
- Unit Placement: Middle
- Property Type: Condominium/Co-Op
- CC Type: Condo
- Style: Mid-Rise
- Other Agent: 1.00
- Year Round: Yes
- Year Built Description: Actual
- Special Features: None
- Property Sub Type: Condos
- Year Built: 2011
Interior Features
- Has Basement: No
- Fireplaces: 1
- Number of Rooms: 4
- Amenities: Public Transportation, Shopping, Park, Walk/Jog Trails, Highway Access, Public School
- Electric: Circuit Breakers
- Energy: Insulated Windows
- Flooring: Tile, Hardwood
- Interior Amenities: Intercom
- Bedroom 2: Second Floor
- Bathroom #1: Second Floor
- Bathroom #2: Second Floor
- Kitchen: Second Floor
- Laundry Room: Second Floor
- Living Room: Second Floor
- Master Bedroom: Second Floor
- Master Bedroom Description: Flooring - Hardwood
- No Bedrooms: 2
- Full Bathrooms: 1
- Half Bathrooms: 1
- No Living Levels: 1
- Main Lo: AN2973
- Main So: AN2593
Exterior Features
- Construction: Frame
- Exterior: Other (See Remarks)
- Exterior Unit Features: Porch
Garage/Parking
- Parking: Off-Street, Assigned
- Parking Spaces: 2
Utilities
- Cooling Zones: 1
- Heat Zones: 1
- Hot Water: Natural Gas, Tank
- Utility Connections: for Gas Range, for Electric Dryer, Washer Hookup
- Sewer: City/Town Sewer
- Water: City/Town Water
Condo/Co-op/Association
- Condominium Name: Gordons Woods
- Association Fee Includes: Water, Sewer, Master Insurance, Elevator, Exterior Maintenance, Snow Removal
- Association Security: Intercom
- Management: Professional - Off Site
- Pets Allowed: Yes w/ Restrictions
- No Units: 42
- Unit Building: 201
Fee Information
- Fee Interval: Monthly
Lot Info
- Zoning: Res
Ownership History
Date
Name
Owned For
Owner Type
Purchase Details
Listed on
May 14, 2019
Closed on
Aug 12, 2019
Sold by
Voght Marjorie E
Bought by
Kwon Miran
Seller's Agent
Alexander Lisek
eXp Realty
Buyer's Agent
Christine Sohn
Premier Realty Group - Lexington
List Price
$485,000
Sold Price
$462,000
Premium/Discount to List
-$23,000
-4.74%
Current Estimated Value
Home Financials for this Owner
Home Financials are based on the most recent Mortgage that was taken out on this home.
Estimated Appreciation
$170,813
Avg. Annual Appreciation
5.09%
Original Mortgage
$422,910
Outstanding Balance
$371,993
Interest Rate
3.7%
Mortgage Type
New Conventional
Estimated Equity
$251,342
Purchase Details
Listed on
Dec 12, 2017
Closed on
Mar 9, 2018
Sold by
Costa Suzanne F
Bought by
Voght Marjorie E
Seller's Agent
Donald Rankin
Conway - West Roxbury
Buyer's Agent
Alexander Lisek
eXp Realty
List Price
$439,000
Sold Price
$441,000
Premium/Discount to List
$2,000
0.46%
Home Financials for this Owner
Home Financials are based on the most recent Mortgage that was taken out on this home.
Avg. Annual Appreciation
3.24%
Original Mortgage
$261,000
Interest Rate
4.15%
Mortgage Type
New Conventional
Purchase Details
Closed on
Oct 31, 2014
Sold by
Pseudoikonomou John
Bought by
Costa Suzanne F
Similar Homes in the area
Create a Home Valuation Report for This Property
The Home Valuation Report is an in-depth analysis detailing your home's value as well as a comparison with similar homes in the area
Home Values in the Area
Average Home Value in this Area
Purchase History
| Date | Type | Sale Price | Title Company |
|---|---|---|---|
| Condominium Deed | $462,000 | -- | |
| Deed | $441,000 | -- | |
| Deed | $396,000 | -- |
Source: Public Records
Mortgage History
| Date | Status | Loan Amount | Loan Type |
|---|---|---|---|
| Open | $422,910 | New Conventional | |
| Previous Owner | $261,000 | New Conventional | |
| Previous Owner | $264,750 | Stand Alone Refi Refinance Of Original Loan |
Source: Public Records
Property History
| Date | Event | Price | Change | Sq Ft Price |
|---|---|---|---|---|
| 02/01/2024 02/01/24 | Rented | $2,900 | +3.6% | -- |
| 02/01/2024 02/01/24 | Under Contract | -- | -- | -- |
| 11/28/2023 11/28/23 | For Rent | $2,800 | 0.0% | -- |
| 08/23/2019 08/23/19 | Sold | $462,000 | -2.7% | $426 / Sq Ft |
| 06/26/2019 06/26/19 | Pending | -- | -- | -- |
| 06/10/2019 06/10/19 | Price Changed | $474,900 | -2.1% | $438 / Sq Ft |
| 05/14/2019 05/14/19 | For Sale | $485,000 | +10.0% | $447 / Sq Ft |
| 03/09/2018 03/09/18 | Sold | $441,000 | +0.5% | $406 / Sq Ft |
| 01/12/2018 01/12/18 | Pending | -- | -- | -- |
| 12/12/2017 12/12/17 | For Sale | $439,000 | +51.9% | $405 / Sq Ft |
| 05/23/2013 05/23/13 | Sold | $289,000 | +9.9% | $355 / Sq Ft |
| 05/09/2013 05/09/13 | Sold | $263,000 | 0.0% | $326 / Sq Ft |
| 04/22/2013 04/22/13 | Pending | -- | -- | -- |
| 04/04/2013 04/04/13 | Pending | -- | -- | -- |
| 03/19/2013 03/19/13 | Price Changed | $263,000 | +6.0% | $326 / Sq Ft |
| 12/21/2012 12/21/12 | Sold | $248,000 | -14.2% | $292 / Sq Ft |
| 12/11/2012 12/11/12 | For Sale | $289,000 | +16.1% | $355 / Sq Ft |
| 11/22/2012 11/22/12 | Pending | -- | -- | -- |
| 11/12/2012 11/12/12 | For Sale | $249,000 | -12.6% | $293 / Sq Ft |
| 11/07/2012 11/07/12 | Sold | $285,000 | -19.3% | $343 / Sq Ft |
| 11/05/2012 11/05/12 | Sold | $353,000 | +22.1% | $325 / Sq Ft |
| 10/12/2012 10/12/12 | Pending | -- | -- | -- |
| 10/10/2012 10/10/12 | For Sale | $289,000 | -19.5% | $347 / Sq Ft |
| 09/27/2012 09/27/12 | Pending | -- | -- | -- |
| 07/27/2012 07/27/12 | Price Changed | $359,000 | 0.0% | $331 / Sq Ft |
| 07/27/2012 07/27/12 | For Sale | $359,000 | +1.7% | $331 / Sq Ft |
| 07/20/2012 07/20/12 | Off Market | $353,000 | -- | -- |
| 07/08/2012 07/08/12 | For Sale | $269,000 | -20.6% | $334 / Sq Ft |
| 04/22/2012 04/22/12 | Pending | -- | -- | -- |
| 03/05/2012 03/05/12 | For Sale | $339,000 | -- | $312 / Sq Ft |
Source: MLS Property Information Network (MLS PIN)
Tax History Compared to Growth
Tax History
| Year | Tax Paid | Tax Assessment Tax Assessment Total Assessment is a certain percentage of the fair market value that is determined by local assessors to be the total taxable value of land and additions on the property. | Land | Improvement |
|---|---|---|---|---|
| 2025 | $6,661 | $575,200 | $0 | $575,200 |
| 2024 | $5,982 | $548,800 | $0 | $548,800 |
| 2023 | $5,720 | $532,600 | $0 | $532,600 |
| 2022 | $5,518 | $507,200 | $0 | $507,200 |
| 2021 | $5,354 | $501,800 | $0 | $501,800 |
| 2020 | $5,049 | $478,100 | $0 | $478,100 |
| 2019 | $4,710 | $446,900 | $0 | $446,900 |
| 2018 | $4,501 | $429,500 | $0 | $429,500 |
| 2017 | $4,373 | $412,900 | $0 | $412,900 |
| 2016 | $4,245 | $385,900 | $0 | $385,900 |
| 2015 | $4,119 | $340,100 | $0 | $340,100 |
| 2014 | $3,925 | $312,000 | $0 | $312,000 |
Source: Public Records
Agents Affiliated with this Home
-
Christine Sohn
C
Seller's Agent in 2024
Christine Sohn
Premier Realty Group - Lexington
(773) 968-2651
25 Total Sales
-
Alexander Lisek
Seller's Agent in 2019
Alexander Lisek
eXp Realty
(617) 877-2469
7 Total Sales
-
Donald Rankin
Seller's Agent in 2018
Donald Rankin
Conway - West Roxbury
(508) 560-3645
1 in this area
26 Total Sales
-
K
Seller's Agent in 2013
Kerri Bonarrigo
Insight Realty Group, Inc.
-
R
Buyer's Agent in 2013
Richmond Lau
V & E Realty
-
Ellen Grubert
Buyer's Agent in 2013
Ellen Grubert
Compass
(617) 256-8455
7 in this area
282 Total Sales
Map
Source: MLS Property Information Network (MLS PIN)
MLS Number: 72263561
APN: WROX-000000-000020-009063-000064
Disclaimer: Certain information contained herein is derived from information provided by parties other than Homes.com. All information provided is deemed reliable, but is not guaranteed to be accurate and should be independently verified.
![]() The property listing data and information, or the Images, set forth herein were provided to MLS Property Information Network, Inc. from third party sources, including sellers, lessors and public records, and were compiled by MLS Property Information Network, Inc. The property listing data and information, and the Images, are for the personal, non-commercial use of consumers having a good faith interest in purchasing or leasing listed properties of the type displayed to them and may not be used for any purpose other than to identify prospective properties which such consumers may have a good faith interest in purchasing or leasing. MLS Property Information Network, Inc. and its subscribers disclaim any and all representations and warranties as to the accuracy of the property listing data and information, or as to the accuracy of any of the Images, set forth herein.
The property listing data and information, or the Images, set forth herein were provided to MLS Property Information Network, Inc. from third party sources, including sellers, lessors and public records, and were compiled by MLS Property Information Network, Inc. The property listing data and information, and the Images, are for the personal, non-commercial use of consumers having a good faith interest in purchasing or leasing listed properties of the type displayed to them and may not be used for any purpose other than to identify prospective properties which such consumers may have a good faith interest in purchasing or leasing. MLS Property Information Network, Inc. and its subscribers disclaim any and all representations and warranties as to the accuracy of the property listing data and information, or as to the accuracy of any of the Images, set forth herein.
Nearby Homes
- 990 Vfw Pkwy Unit 302
- 381 Baker St
- 100 Keith St
- 331 Vermont St
- 349 Baker St
- 349 Baker St Unit A
- 180 Dent St
- 9 Carroll St
- 1214 Vfw Pkwy Unit 37
- 1216 Vfw Pkwy Unit 40
- 1216 Vfw Pkwy Unit 47
- 583 Baker St Unit 583
- 15 Atlantis St
- 615 Lagrange St
- 196 Gardner St Unit 196
- 840 Vfw Pkwy
- 146 Spring St
- 116 Spring St Unit D2
- 5 Cass St Unit 12
- 17 Powell St