
1100 Vfw Pkwy Unit 201 West Roxbury, MA 02132
West Roxbury Neighborhood
1
Bed
1
Bath
849
Sq Ft
1,089
Sq Ft Lot
About This Home
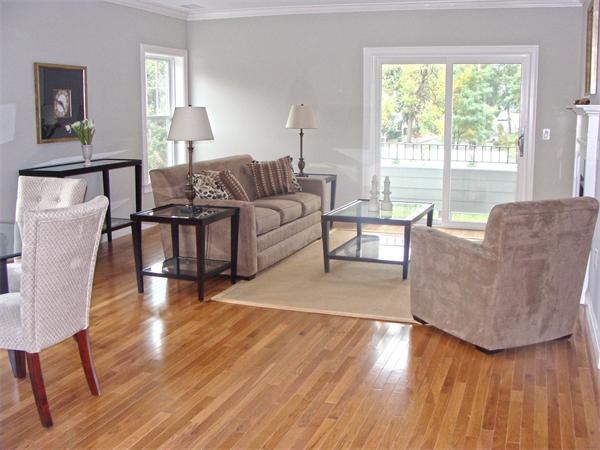
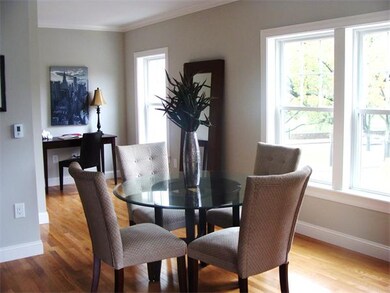
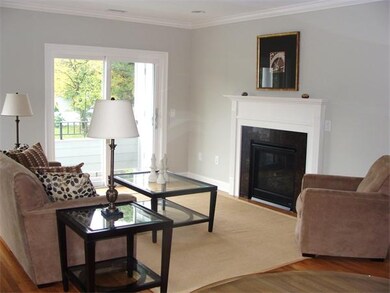
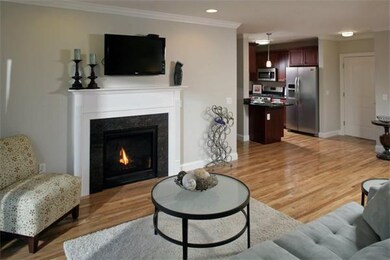
As of August 2019This brand new construction front facing home features a open floor plan living room, ample size bedroom and crown modeling. Gordon's Woods offers amazing value in an energy efficient condominium building, with homes starting from $249K up to $389K. Homes features include hardwood floors, ss appliances, granite counter tops, gas fireplaces and deeded parking. Home layouts vary from 1 bed 1 bath flat and 2 bed 1.5 bath flat.
Last Agent to Sell the Property
Kerri Bonarrigo
Insight Realty Group, Inc. Listed on: 11/12/2012
Last Buyer's Agent
Ronald Chow
American Fortune Real Estate License #449528559
Ownership History
Date
Name
Owned For
Owner Type
Purchase Details
Listed on
May 14, 2019
Closed on
Aug 12, 2019
Sold by
Voght Marjorie E
Bought by
Kwon Miran
Seller's Agent
Alexander Lisek
eXp Realty
Buyer's Agent
Christine Sohn
Premier Realty Group - Lexington
List Price
$485,000
Sold Price
$462,000
Premium/Discount to List
-$23,000
-4.74%
Total Days on Market
10
Current Estimated Value
Home Financials for this Owner
Home Financials are based on the most recent Mortgage that was taken out on this home.
Estimated Appreciation
$110,794
Avg. Annual Appreciation
3.79%
Original Mortgage
$422,910
Outstanding Balance
$374,377
Interest Rate
3.7%
Mortgage Type
New Conventional
Estimated Equity
$198,417
Purchase Details
Listed on
Dec 12, 2017
Closed on
Mar 9, 2018
Sold by
Costa Suzanne F
Bought by
Voght Marjorie E
Seller's Agent
Donald Rankin
Conway - West Roxbury
Buyer's Agent
Alexander Lisek
eXp Realty
List Price
$439,000
Sold Price
$441,000
Premium/Discount to List
$2,000
0.46%
Home Financials for this Owner
Home Financials are based on the most recent Mortgage that was taken out on this home.
Avg. Annual Appreciation
3.24%
Original Mortgage
$261,000
Interest Rate
4.15%
Mortgage Type
New Conventional
Purchase Details
Closed on
Oct 31, 2014
Sold by
Pseudoikonomou John
Bought by
Costa Suzanne F
Similar Home in West Roxbury, MA
Create a Home Valuation Report for This Property
The Home Valuation Report is an in-depth analysis detailing your home's value as well as a comparison with similar homes in the area
Home Values in the Area
Average Home Value in this Area
Purchase History
| Date | Type | Sale Price | Title Company |
|---|---|---|---|
| Condominium Deed | $462,000 | -- | |
| Deed | $441,000 | -- | |
| Deed | $396,000 | -- |
Source: Public Records
Mortgage History
| Date | Status | Loan Amount | Loan Type |
|---|---|---|---|
| Open | $422,910 | New Conventional | |
| Previous Owner | $261,000 | New Conventional | |
| Previous Owner | $264,750 | Stand Alone Refi Refinance Of Original Loan |
Source: Public Records
Property History
| Date | Event | Price | Change | Sq Ft Price |
|---|---|---|---|---|
| 02/01/2024 02/01/24 | Rented | $2,900 | +3.6% | -- |
| 02/01/2024 02/01/24 | Under Contract | -- | -- | -- |
| 11/28/2023 11/28/23 | For Rent | $2,800 | 0.0% | -- |
| 08/23/2019 08/23/19 | Sold | $462,000 | -2.7% | $426 / Sq Ft |
| 06/26/2019 06/26/19 | Pending | -- | -- | -- |
| 06/10/2019 06/10/19 | Price Changed | $474,900 | -2.1% | $438 / Sq Ft |
| 05/14/2019 05/14/19 | For Sale | $485,000 | +10.0% | $447 / Sq Ft |
| 03/09/2018 03/09/18 | Sold | $441,000 | +0.5% | $406 / Sq Ft |
| 01/12/2018 01/12/18 | Pending | -- | -- | -- |
| 12/12/2017 12/12/17 | For Sale | $439,000 | +51.9% | $405 / Sq Ft |
| 05/23/2013 05/23/13 | Sold | $289,000 | +9.9% | $355 / Sq Ft |
| 05/09/2013 05/09/13 | Sold | $263,000 | 0.0% | $326 / Sq Ft |
| 04/22/2013 04/22/13 | Pending | -- | -- | -- |
| 04/04/2013 04/04/13 | Pending | -- | -- | -- |
| 03/19/2013 03/19/13 | Price Changed | $263,000 | +6.0% | $326 / Sq Ft |
| 12/21/2012 12/21/12 | Sold | $248,000 | -14.2% | $292 / Sq Ft |
| 12/11/2012 12/11/12 | For Sale | $289,000 | +16.1% | $355 / Sq Ft |
| 11/22/2012 11/22/12 | Pending | -- | -- | -- |
| 11/12/2012 11/12/12 | For Sale | $249,000 | -12.6% | $293 / Sq Ft |
| 11/07/2012 11/07/12 | Sold | $285,000 | -19.3% | $343 / Sq Ft |
| 11/05/2012 11/05/12 | Sold | $353,000 | +22.1% | $325 / Sq Ft |
| 10/12/2012 10/12/12 | Pending | -- | -- | -- |
| 10/10/2012 10/10/12 | For Sale | $289,000 | -19.5% | $347 / Sq Ft |
| 09/27/2012 09/27/12 | Pending | -- | -- | -- |
| 07/27/2012 07/27/12 | Price Changed | $359,000 | 0.0% | $331 / Sq Ft |
| 07/27/2012 07/27/12 | For Sale | $359,000 | +1.7% | $331 / Sq Ft |
| 07/20/2012 07/20/12 | Off Market | $353,000 | -- | -- |
| 07/08/2012 07/08/12 | For Sale | $269,000 | -20.6% | $334 / Sq Ft |
| 04/22/2012 04/22/12 | Pending | -- | -- | -- |
| 03/05/2012 03/05/12 | For Sale | $339,000 | -- | $312 / Sq Ft |
Source: MLS Property Information Network (MLS PIN)
Tax History Compared to Growth
Tax History
| Year | Tax Paid | Tax Assessment Tax Assessment Total Assessment is a certain percentage of the fair market value that is determined by local assessors to be the total taxable value of land and additions on the property. | Land | Improvement |
|---|---|---|---|---|
| 2025 | $6,661 | $575,200 | $0 | $575,200 |
| 2024 | $5,982 | $548,800 | $0 | $548,800 |
| 2023 | $5,720 | $532,600 | $0 | $532,600 |
| 2022 | $5,518 | $507,200 | $0 | $507,200 |
| 2021 | $5,354 | $501,800 | $0 | $501,800 |
| 2020 | $5,049 | $478,100 | $0 | $478,100 |
| 2019 | $4,710 | $446,900 | $0 | $446,900 |
| 2018 | $4,501 | $429,500 | $0 | $429,500 |
| 2017 | $4,373 | $412,900 | $0 | $412,900 |
| 2016 | $4,245 | $385,900 | $0 | $385,900 |
| 2015 | $4,119 | $340,100 | $0 | $340,100 |
| 2014 | $3,925 | $312,000 | $0 | $312,000 |
Source: Public Records
Agents Affiliated with this Home
-
Christine Sohn
C
Seller's Agent in 2024
Christine Sohn
Premier Realty Group - Lexington
(773) 968-2651
24 Total Sales
-
Alexander Lisek
Seller's Agent in 2019
Alexander Lisek
eXp Realty
(617) 877-2469
8 Total Sales
-
Donald Rankin
Seller's Agent in 2018
Donald Rankin
Conway - West Roxbury
(508) 560-3645
1 in this area
26 Total Sales
-
K
Seller's Agent in 2013
Kerri Bonarrigo
Insight Realty Group, Inc.
-
Richmond Lau
R
Buyer's Agent in 2013
Richmond Lau
V & E Realty
(617) 786-9399
1 in this area
9 Total Sales
-
Ellen Grubert
Buyer's Agent in 2013
Ellen Grubert
Compass
(617) 256-8455
7 in this area
302 Total Sales
Map
Source: MLS Property Information Network (MLS PIN)
MLS Number: 71459320
APN: WROX-000000-000020-009063-000064
Disclaimer: Certain information contained herein is derived from information provided by parties other than Homes.com. All information provided is deemed reliable, but is not guaranteed to be accurate and should be independently verified.
![]() The property listing data and information, or the Images, set forth herein were provided to MLS Property Information Network, Inc. from third party sources, including sellers, lessors and public records, and were compiled by MLS Property Information Network, Inc. The property listing data and information, and the Images, are for the personal, non-commercial use of consumers having a good faith interest in purchasing or leasing listed properties of the type displayed to them and may not be used for any purpose other than to identify prospective properties which such consumers may have a good faith interest in purchasing or leasing. MLS Property Information Network, Inc. and its subscribers disclaim any and all representations and warranties as to the accuracy of the property listing data and information, or as to the accuracy of any of the Images, set forth herein.
The property listing data and information, or the Images, set forth herein were provided to MLS Property Information Network, Inc. from third party sources, including sellers, lessors and public records, and were compiled by MLS Property Information Network, Inc. The property listing data and information, and the Images, are for the personal, non-commercial use of consumers having a good faith interest in purchasing or leasing listed properties of the type displayed to them and may not be used for any purpose other than to identify prospective properties which such consumers may have a good faith interest in purchasing or leasing. MLS Property Information Network, Inc. and its subscribers disclaim any and all representations and warranties as to the accuracy of the property listing data and information, or as to the accuracy of any of the Images, set forth herein.
Nearby Homes
- 990 Vfw Pkwy Unit 302
- 23 Baker Place
- 293 Temple St Unit 101
- 349 Baker St Unit A
- 349 Baker St Unit B
- 184 Perham St
- 1214 Vfw Pkwy Unit 37
- 633 Lagrange St
- 188 Gardner St Unit 188
- 41 Wycliff Ave
- 24 Ivory St
- 45 Moville St
- 487 Lagrange St
- 1 Furbush Rd
- 80 Mount Vernon St
- 116 Spring St Unit D2
- 59 Chellman St
- 76 Brook Farm Rd
- 19 Powell St
- 21 Powell St