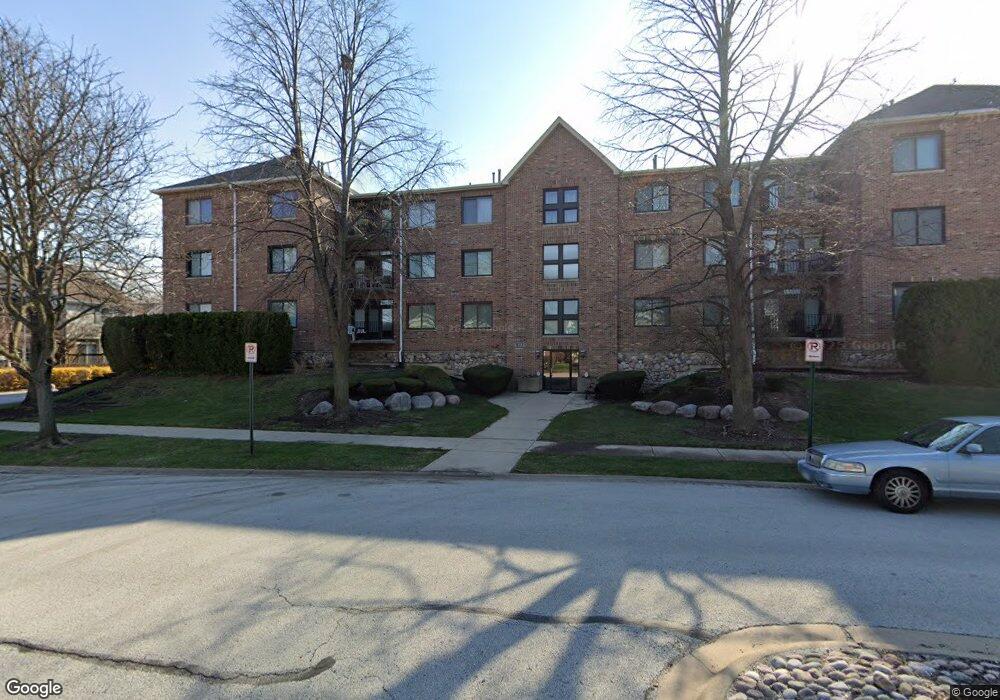
11001 Deblin Ln Unit 1100110 Oak Lawn, IL 60453
Estimated Value: $210,000 - $237,000
2
Beds
2
Baths
1,375
Sq Ft
$163/Sq Ft
Est. Value
About This Home
This home is located at 11001 Deblin Ln Unit 1100110, Oak Lawn, IL 60453 and is currently estimated at $223,749, approximately $162 per square foot. 11001 Deblin Ln Unit 1100110 is a home located in Cook County with nearby schools including Stony Creek Elementary School, Prairie Jr High School, and Harold L. Richards High School.
Ownership History
Date
Name
Owned For
Owner Type
Purchase Details
Closed on
Mar 8, 2023
Sold by
Curran Erin J
Bought by
Kelly Family Trust
Current Estimated Value
Purchase Details
Closed on
May 15, 2013
Sold by
Connolly Joyce A and Connolly Martin P
Bought by
Curran Alison V
Home Financials for this Owner
Home Financials are based on the most recent Mortgage that was taken out on this home.
Original Mortgage
$76,500
Interest Rate
5%
Mortgage Type
New Conventional
Purchase Details
Closed on
Dec 8, 1998
Sold by
Lemaich Michael and Lemaich Bernice
Bought by
Lemaich Michael and Lemaich Bernice K
Purchase Details
Closed on
Sep 13, 1996
Sold by
Trembacki Frank J and Trembacki Mary R
Bought by
Lemaich Michael and Lemaich Bernice
Create a Home Valuation Report for This Property
The Home Valuation Report is an in-depth analysis detailing your home's value as well as a comparison with similar homes in the area
Home Values in the Area
Average Home Value in this Area
Purchase History
| Date | Buyer | Sale Price | Title Company |
|---|---|---|---|
| Kelly Family Trust | $155,000 | Chicago Title | |
| Curran Alison V | $85,000 | Fidelity National Title | |
| Lemaich Michael | -- | -- | |
| Lemaich Michael | $153,000 | -- |
Source: Public Records
Mortgage History
| Date | Status | Borrower | Loan Amount |
|---|---|---|---|
| Previous Owner | Curran Alison V | $115,000 | |
| Previous Owner | Curran Alison V | $35,598 | |
| Previous Owner | Curran Alison V | $76,500 |
Source: Public Records
Tax History Compared to Growth
Tax History
| Year | Tax Paid | Tax Assessment Tax Assessment Total Assessment is a certain percentage of the fair market value that is determined by local assessors to be the total taxable value of land and additions on the property. | Land | Improvement |
|---|---|---|---|---|
| 2024 | $3,897 | $16,833 | $1,604 | $15,229 |
| 2023 | $3,820 | $16,833 | $1,604 | $15,229 |
| 2022 | $3,820 | $14,445 | $1,711 | $12,734 |
| 2021 | $3,679 | $14,443 | $1,710 | $12,733 |
| 2020 | $3,755 | $14,443 | $1,710 | $12,733 |
| 2019 | $3,824 | $14,066 | $1,550 | $12,516 |
| 2018 | $3,675 | $14,066 | $1,550 | $12,516 |
| 2017 | $3,749 | $14,066 | $1,550 | $12,516 |
| 2016 | $3,415 | $11,714 | $1,282 | $10,432 |
| 2015 | $3,364 | $11,714 | $1,282 | $10,432 |
| 2014 | $3,305 | $11,714 | $1,282 | $10,432 |
| 2013 | $4,522 | $16,171 | $1,282 | $14,889 |
Source: Public Records
Map
Nearby Homes
- 11000 Deblin Ln
- 11035 Deblin Ln Unit 205
- 5121 Deblin Ln
- 11036 Jodan Dr Unit 3D
- 10824 Lavergne Ave
- 10720 Laramie Ave
- 4917 W 109th St Unit 202
- 10724 Leclaire Ave
- 4833 W 109th St Unit 103
- 5335 W 108th Place
- 10745 Lockwood Ave
- 4831 W 109th St Unit 9101
- 4829 W 109th St Unit 203
- 4829 W 109th St Unit 301
- 4825 W 109th St Unit 303
- 11234 S Lawler Ave
- 11236 S Lawler Ave
- 11300 S Leclaire Ave
- 4819 W 109th St Unit 204
- 10720 Lamon Ave
- 11001 Deblin Ln Unit 203
- 11001 Deblin Ln Unit 202
- 11001 Deblin Ln Unit 305
- 11001 Deblin Ln
- 11001 Deblin Ln Unit 1100120
- 11001 Deblin Ln
- 11001 Deblin Ln
- 11001 Deblin Ln Unit 201
- 11001 Deblin Ln Unit 208
- 11001 Deblin Ln Unit 1100110
- 11001 Deblin Ln Unit 306
- 11001 Deblin Ln Unit 301
- 11001 Deblin Ln Unit 1100120
- 11001 Deblin Ln Unit 303
- 11001 Deblin Ln Unit 308
- 11001 Deblin Ln Unit 207
- 11001 Deblin Ln Unit 204
- 11001 Deblin Ln Unit 1100120
- 11001 Deblin Ln Unit 1100130
- 11001 Deblin Ln Unit 305