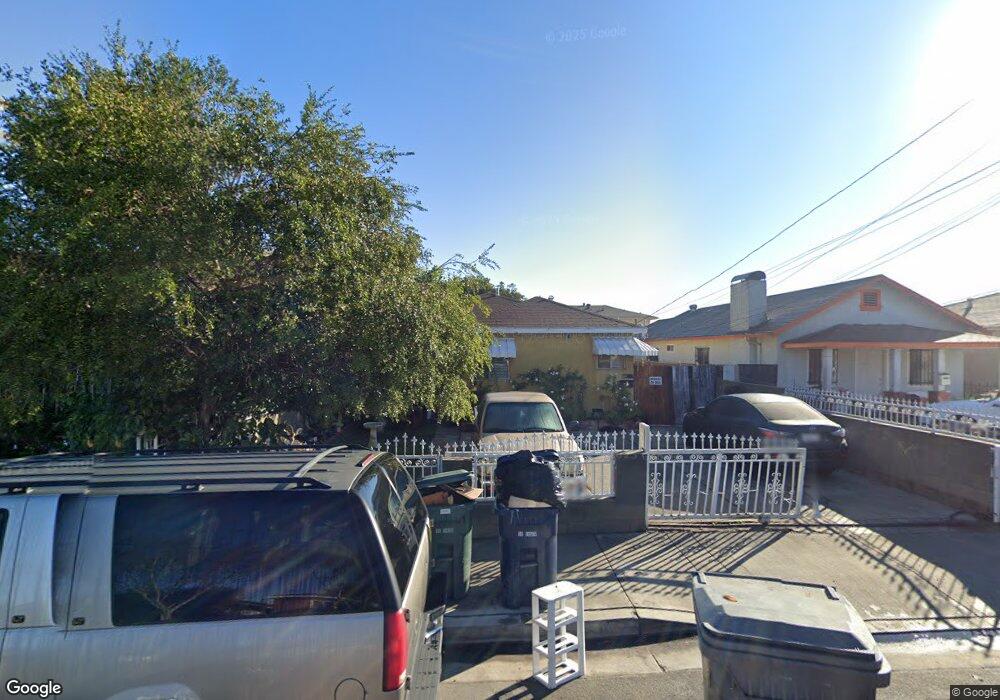
11006 Firmona Ave Inglewood, CA 90304
Lennox NeighborhoodEstimated Value: $748,000 - $846,000
4
Beds
3
Baths
1,467
Sq Ft
$551/Sq Ft
Est. Value
About This Home
This home is located at 11006 Firmona Ave, Inglewood, CA 90304 and is currently estimated at $808,542, approximately $551 per square foot. 11006 Firmona Ave is a home located in Los Angeles County with nearby schools including Jefferson Elementary School, Lennox Middle School, and Hawthorne High School.
Ownership History
Date
Name
Owned For
Owner Type
Purchase Details
Closed on
Apr 13, 2023
Sold by
Ibarra Joel and Ibarra Maria
Bought by
Living Trust
Current Estimated Value
Purchase Details
Closed on
Jan 25, 2016
Sold by
Pina Joel and Pina Joel Ibarra
Bought by
Pina Joel and Ibarra Maria
Home Financials for this Owner
Home Financials are based on the most recent Mortgage that was taken out on this home.
Original Mortgage
$294,697
Interest Rate
3.93%
Mortgage Type
New Conventional
Purchase Details
Closed on
Oct 5, 2003
Sold by
Escobedo Gregorio and Escobedo Maria Delcarmen
Bought by
Pina Joel Ibarra
Home Financials for this Owner
Home Financials are based on the most recent Mortgage that was taken out on this home.
Original Mortgage
$224,000
Interest Rate
7.5%
Mortgage Type
Purchase Money Mortgage
Create a Home Valuation Report for This Property
The Home Valuation Report is an in-depth analysis detailing your home's value as well as a comparison with similar homes in the area
Home Values in the Area
Average Home Value in this Area
Purchase History
| Date | Buyer | Sale Price | Title Company |
|---|---|---|---|
| Living Trust | -- | None Listed On Document | |
| Pina Joel | -- | None Available | |
| Pina Joel Ibarra | $280,000 | Investors Title Company |
Source: Public Records
Mortgage History
| Date | Status | Borrower | Loan Amount |
|---|---|---|---|
| Previous Owner | Pina Joel | $294,697 | |
| Previous Owner | Pina Joel Ibarra | $224,000 | |
| Closed | Pina Joel Ibarra | $56,000 |
Source: Public Records
Tax History Compared to Growth
Tax History
| Year | Tax Paid | Tax Assessment Tax Assessment Total Assessment is a certain percentage of the fair market value that is determined by local assessors to be the total taxable value of land and additions on the property. | Land | Improvement |
|---|---|---|---|---|
| 2025 | $6,971 | $398,082 | $277,240 | $120,842 |
| 2024 | $6,971 | $390,277 | $271,804 | $118,473 |
| 2023 | $6,667 | $382,625 | $266,475 | $116,150 |
| 2022 | $6,577 | $375,123 | $261,250 | $113,873 |
| 2021 | $6,356 | $367,769 | $256,128 | $111,641 |
| 2020 | $6,164 | $364,199 | $253,502 | $110,697 |
| 2019 | $5,831 | $357,063 | $248,532 | $108,531 |
| 2018 | $5,678 | $350,066 | $243,659 | $106,407 |
| 2016 | $5,163 | $336,283 | $234,199 | $102,084 |
| 2015 | $5,023 | $331,233 | $230,682 | $100,551 |
| 2014 | $4,994 | $324,746 | $226,164 | $98,582 |
Source: Public Records
Map
Nearby Homes
- 11031 S Burin Ave
- 4505 Lennox Blvd
- 10905 Dalerose Ave
- 10910 S Burl Ave
- 4341 W 106th St
- 4322 W 106th St
- 4900 Lennox Blvd
- 11319 Larch Ave
- 4323 W 105th St
- 10333 S Inglewood Ave
- 4136 W 111th St
- 11521 Inglewood Ave
- 11620 Inglewood Ave
- 4115 W 111th St
- 11537 Birch Ave
- 4703 W 118th St
- 4203 W 104th St
- 10914 S Osage Ave
- 11830 Manor Dr Unit A
- 11835 Gale Ave
- 11010 Firmona Ave
- 11004 Firmona Ave
- 11014 Firmona Ave
- 11016 S Freeman Ave
- 10932 Firmona Ave
- 11020 Firmona Ave
- 11005 Mansel Ave
- 11009 Mansel Ave
- 11001 Mansel Ave
- 11013 Mansel Ave
- 11024 Firmona Ave
- 10928 Firmona Ave
- 10935 Mansel Ave
- 11017 Mansel Ave
- 11005 Firmona Ave
- 11011 Firmona Ave
- 10931 Mansel Ave
- 11021 Mansel Ave
- 11001 Firmona Ave
- 11015 Firmona Ave