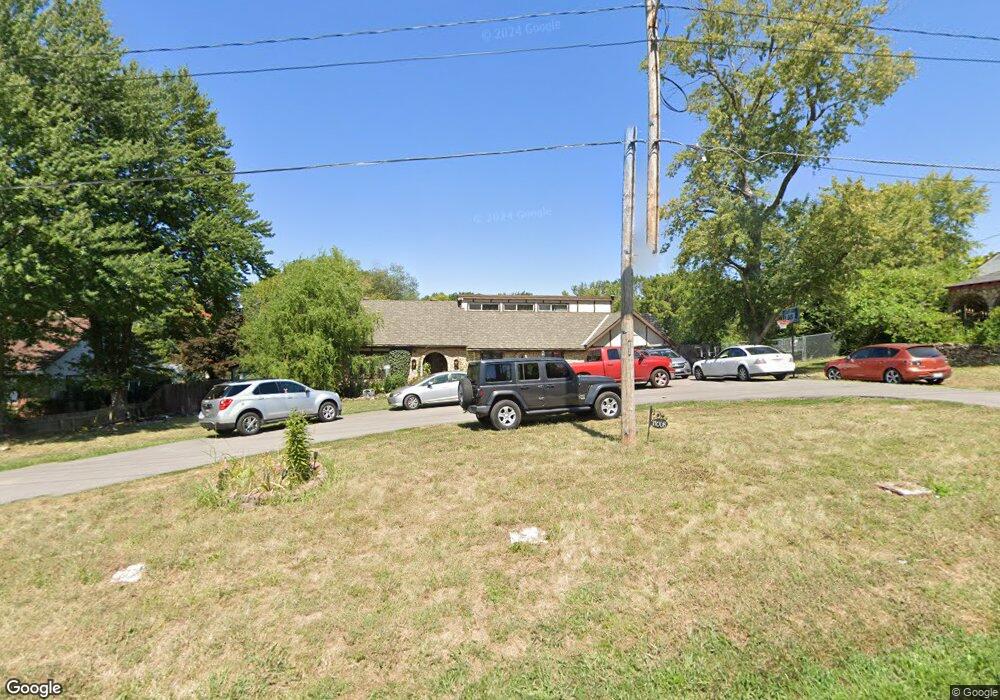
11008 E 35th St S Independence, MO 64052
Rock Creek South NeighborhoodEstimated Value: $229,000 - $419,000
4
Beds
3
Baths
4,266
Sq Ft
$79/Sq Ft
Est. Value
About This Home
This home is located at 11008 E 35th St S, Independence, MO 64052 and is currently estimated at $337,431, approximately $79 per square foot. 11008 E 35th St S is a home located in Jackson County with nearby schools including Three Trails Elementary School, Clifford H. Nowlin Middle School, and Van Horn High School.
Ownership History
Date
Name
Owned For
Owner Type
Purchase Details
Closed on
Mar 18, 2011
Sold by
Franks Warren Mark and Franks Fiorella D
Bought by
Franks Warren Mark and Franks Fiorella D
Current Estimated Value
Home Financials for this Owner
Home Financials are based on the most recent Mortgage that was taken out on this home.
Original Mortgage
$105,080
Outstanding Balance
$4,706
Interest Rate
4.32%
Mortgage Type
New Conventional
Estimated Equity
$332,725
Purchase Details
Closed on
Aug 9, 2010
Sold by
Federal Home Loan Mortgage Corporation
Bought by
Camacho Fiorella S
Home Financials for this Owner
Home Financials are based on the most recent Mortgage that was taken out on this home.
Original Mortgage
$105,080
Interest Rate
4.6%
Mortgage Type
Future Advance Clause Open End Mortgage
Purchase Details
Closed on
Sep 10, 2004
Sold by
Kansas City Temple Church Bibleway Inc
Bought by
Hammond Sheryll
Home Financials for this Owner
Home Financials are based on the most recent Mortgage that was taken out on this home.
Original Mortgage
$115,900
Interest Rate
6.08%
Mortgage Type
Purchase Money Mortgage
Create a Home Valuation Report for This Property
The Home Valuation Report is an in-depth analysis detailing your home's value as well as a comparison with similar homes in the area
Home Values in the Area
Average Home Value in this Area
Purchase History
| Date | Buyer | Sale Price | Title Company |
|---|---|---|---|
| Franks Warren Mark | -- | None Available | |
| Camacho Fiorella S | -- | Stewart Title | |
| Hammond Sheryll | -- | Stewart Title Of Ks City Inc |
Source: Public Records
Mortgage History
| Date | Status | Borrower | Loan Amount |
|---|---|---|---|
| Open | Franks Warren Mark | $105,080 | |
| Closed | Camacho Fiorella S | $105,080 | |
| Previous Owner | Hammond Sheryll | $115,900 |
Source: Public Records
Tax History
| Year | Tax Paid | Tax Assessment Tax Assessment Total Assessment is a certain percentage of the fair market value that is determined by local assessors to be the total taxable value of land and additions on the property. | Land | Improvement |
|---|---|---|---|---|
| 2025 | $3,593 | $47,993 | $6,088 | $41,905 |
| 2024 | $3,505 | $50,392 | $8,356 | $42,036 |
| 2023 | $3,505 | $50,392 | $2,618 | $47,774 |
| 2022 | $2,764 | $36,290 | $8,113 | $28,177 |
| 2021 | $2,753 | $36,290 | $8,113 | $28,177 |
| 2020 | $2,466 | $31,643 | $8,113 | $23,530 |
| 2019 | $2,430 | $31,643 | $8,113 | $23,530 |
| 2018 | $2,129 | $26,943 | $4,903 | $22,040 |
| 2016 | $2,087 | $25,805 | $4,110 | $21,695 |
Source: Public Records
Map
Nearby Homes
- 11120 E 36th St S
- 10501 E 35th St S
- 2519 S Claremont Ave
- 3704 S Claremont Ave
- 3301 S Vermont Ave
- 3410 Blue Ridge Blvd
- 3310 S Maywood Ave
- 2929 S Northern Blvd
- 3209 S Norton Ave
- 2917 Mason Ave
- 2916 S Mason Ave
- 3037 S Scott Ave
- 3228 S Cedar Ave
- 4023 Hedges Ave
- 10212 E 31st St S
- 12108 Markham Rd
- 11241 Highridge Dr
- 4020 Hedges Ave
- 9930 E 36th St S
- 11628 E 38th Terrace S
- 11012 E 35th St S
- 11004 E 35th St S
- 11009 E 35th St S
- 11015 E 35th St S
- 11016 E 35th St S
- 11000 E 35th St S
- 11001 E 35th St S
- 11005 E 35th St S
- 11101 E 35th St S
- 11105 E 35th St S
- 11018 E 35th St S
- 3415 S Harris Ave
- 0 E 35th St S
- 10915 E 35th St S
- 11107 E 35th St S
- 10908 E 35th St St S
- 11004 E 35th Terrace S
- 11100 E 35th Terrace S
- 11104 E 35th Terrace S
- 3416 S Sterling Ave
Your Personal Tour Guide
Ask me questions while you tour the home.