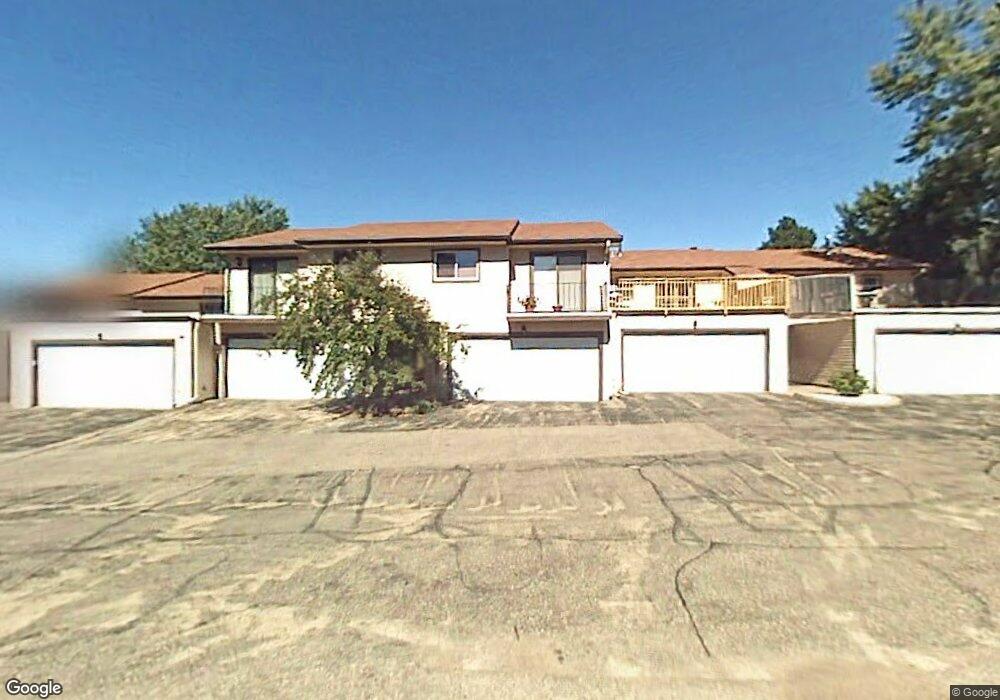
11008 Trail West Rd Unit 1100 Bloomington, MN 55437
West Bloomington NeighborhoodEstimated Value: $256,000 - $291,000
3
Beds
2
Baths
588
Sq Ft
$469/Sq Ft
Est. Value
About This Home
This home is located at 11008 Trail West Rd Unit 1100, Bloomington, MN 55437 and is currently estimated at $275,738, approximately $468 per square foot. 11008 Trail West Rd Unit 1100 is a home located in Hennepin County with nearby schools including Westwood Elementary School, Oak Grove Middle School, and Jefferson Senior High School.
Ownership History
Date
Name
Owned For
Owner Type
Purchase Details
Closed on
Feb 5, 2021
Sold by
Gomez Oscar Hernandez
Bought by
Gomez Oscar Hernandez and Vazquez Blanca E
Current Estimated Value
Purchase Details
Closed on
Mar 1, 2017
Sold by
Adavntage Assets Llc
Bought by
Gomez Oscar Hernandez
Home Financials for this Owner
Home Financials are based on the most recent Mortgage that was taken out on this home.
Original Mortgage
$176,739
Outstanding Balance
$146,886
Interest Rate
4.25%
Mortgage Type
FHA
Estimated Equity
$128,852
Purchase Details
Closed on
Oct 28, 2016
Sold by
Wendt Giuliana Rosin
Bought by
Advantage Assets Llc
Home Financials for this Owner
Home Financials are based on the most recent Mortgage that was taken out on this home.
Original Mortgage
$100,000
Interest Rate
3.48%
Mortgage Type
Commercial
Purchase Details
Closed on
Dec 30, 1998
Sold by
Olesen Elizabeth A
Bought by
Wendt Giuliana Rosin
Create a Home Valuation Report for This Property
The Home Valuation Report is an in-depth analysis detailing your home's value as well as a comparison with similar homes in the area
Home Values in the Area
Average Home Value in this Area
Purchase History
| Date | Buyer | Sale Price | Title Company |
|---|---|---|---|
| Gomez Oscar Hernandez | -- | Executive Title Services | |
| Gomez Oscar Hernandez | $180,000 | Executive Title Svcs Inc | |
| Advantage Assets Llc | $100,000 | Gibraltar Title Agency Llc | |
| Wendt Giuliana Rosin | $104,900 | -- |
Source: Public Records
Mortgage History
| Date | Status | Borrower | Loan Amount |
|---|---|---|---|
| Open | Gomez Oscar Hernandez | $176,739 | |
| Previous Owner | Advantage Assets Llc | $100,000 |
Source: Public Records
Tax History Compared to Growth
Tax History
| Year | Tax Paid | Tax Assessment Tax Assessment Total Assessment is a certain percentage of the fair market value that is determined by local assessors to be the total taxable value of land and additions on the property. | Land | Improvement |
|---|---|---|---|---|
| 2024 | $3,391 | $261,700 | $39,900 | $221,800 |
| 2023 | $3,027 | $251,600 | $39,900 | $211,700 |
| 2022 | $2,496 | $248,900 | $39,900 | $209,000 |
| 2021 | $2,376 | $210,700 | $38,500 | $172,200 |
| 2020 | $2,356 | $203,500 | $37,900 | $165,600 |
| 2019 | $2,164 | $197,200 | $37,800 | $159,400 |
| 2018 | $1,938 | $180,600 | $38,000 | $142,600 |
| 2017 | $1,805 | $153,200 | $35,000 | $118,200 |
| 2016 | $1,624 | $135,200 | $33,400 | $101,800 |
| 2015 | $1,671 | $133,800 | $32,800 | $101,000 |
| 2014 | -- | $130,300 | $32,400 | $97,900 |
Source: Public Records
Map
Nearby Homes
- 11115 Vessey Cir
- 5100 Balmoral Ln
- 11252 Vessey Ave S
- 5275 Balmoral Ln
- 10916 Oxborough Ave S
- 4725 W 110th St
- 5410 W Old Shakopee Cir
- 10726 Toledo Ct
- 11313 Xavier Rd
- 5392 W Old Shakopee Cir
- 4600 Morris Ln
- 10600 Normandale Blvd
- 10727 Braewood Cir
- 11024 Little Ave S
- 4816 Overlook Dr
- 11509 Palmer Rd
- 10616 Johnson Rd
- 11416 Kell Rd
- 10525 Nesbitt Ave S
- 11341 Kell Rd
- 11008 Trail West Rd
- 11012 Trail West Rd
- 11012 Trail Rd W
- 11004 Trail West Rd
- 11016 Trail West Rd
- 11000 Trail West Rd
- 11016 Trail Rd W
- 11020 Trail West Rd
- 11024 Trail West Rd
- 11028 Trail Rd W
- 11028 Trail West Rd
- 11032 Trail West Rd
- 5245 W 110th St
- 11036 Trail West Rd
- 11036 Trail Rd W
- 11050 Stanley Rd
- 5280 W 110th St
- 11052 Trail West Rd
- 10941 Normandale Blvd
- 11048 Trail West Rd