1101 18th St West Des Moines, IA 50265
Estimated Value: $311,000 - $437,000
3
Beds
3
Baths
2,054
Sq Ft
$191/Sq Ft
Est. Value
About This Home
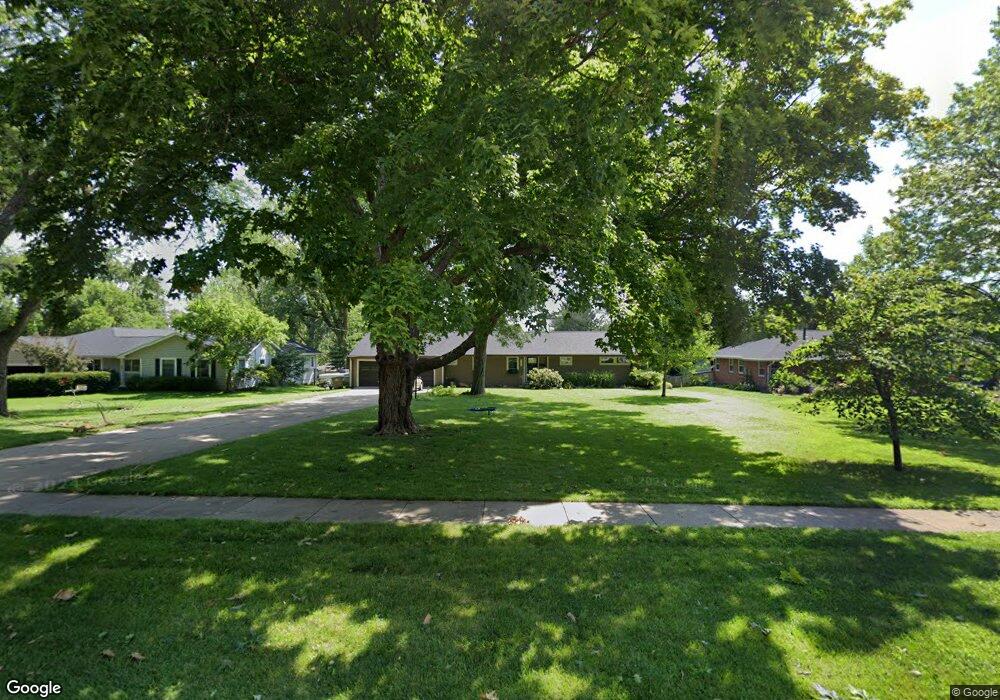
This home is located at 1101 18th St, West Des Moines, IA 50265 and is currently estimated at $391,739, approximately $190 per square foot. 1101 18th St is a home located in Polk County with nearby schools including Fairmeadows Elementary School, Stilwell Junior High School, and Valley Southwoods Freshman High School.
Ownership History
Date
Name
Owned For
Owner Type
Purchase Details
Closed on
Aug 16, 2016
Sold by
Colby Michael P and Colby Jennifer L
Bought by
Sunderman Thomas and Sunderman Jodi
Current Estimated Value
Home Financials for this Owner
Home Financials are based on the most recent Mortgage that was taken out on this home.
Original Mortgage
$248,000
Outstanding Balance
$197,427
Interest Rate
3.41%
Mortgage Type
New Conventional
Estimated Equity
$194,312
Purchase Details
Closed on
Oct 16, 2008
Sold by
Schwartz Becky
Bought by
Colby Michael P and Colby Jennifer L
Home Financials for this Owner
Home Financials are based on the most recent Mortgage that was taken out on this home.
Original Mortgage
$181,450
Interest Rate
5.73%
Mortgage Type
Purchase Money Mortgage
Purchase Details
Closed on
Apr 3, 1997
Sold by
Schwartz George H and Schwartz Betty M
Bought by
Betty M Schwartz Living Trust
Create a Home Valuation Report for This Property
The Home Valuation Report is an in-depth analysis detailing your home's value as well as a comparison with similar homes in the area
Home Values in the Area
Average Home Value in this Area
Purchase History
| Date | Buyer | Sale Price | Title Company |
|---|---|---|---|
| Sunderman Thomas | -- | None Available | |
| Colby Michael P | $190,500 | None Available | |
| Betty M Schwartz Living Trust | -- | -- |
Source: Public Records
Mortgage History
| Date | Status | Borrower | Loan Amount |
|---|---|---|---|
| Open | Sunderman Thomas | $248,000 | |
| Previous Owner | Colby Michael P | $181,450 |
Source: Public Records
Tax History Compared to Growth
Tax History
| Year | Tax Paid | Tax Assessment Tax Assessment Total Assessment is a certain percentage of the fair market value that is determined by local assessors to be the total taxable value of land and additions on the property. | Land | Improvement |
|---|---|---|---|---|
| 2025 | $5,856 | $428,500 | $97,400 | $331,100 |
| 2024 | $5,856 | $379,900 | $85,400 | $294,500 |
| 2023 | $5,742 | $379,900 | $85,400 | $294,500 |
| 2022 | $5,672 | $306,200 | $71,700 | $234,500 |
| 2021 | $5,350 | $306,200 | $71,700 | $234,500 |
| 2020 | $5,266 | $275,400 | $64,400 | $211,000 |
| 2019 | $4,994 | $275,400 | $64,400 | $211,000 |
| 2018 | $5,002 | $252,300 | $57,900 | $194,400 |
| 2017 | $3,814 | $252,300 | $57,900 | $194,400 |
| 2016 | $3,726 | $188,900 | $53,600 | $135,300 |
| 2015 | $3,726 | $188,900 | $53,600 | $135,300 |
| 2014 | $3,506 | $176,300 | $49,300 | $127,000 |
Source: Public Records
Map
Nearby Homes