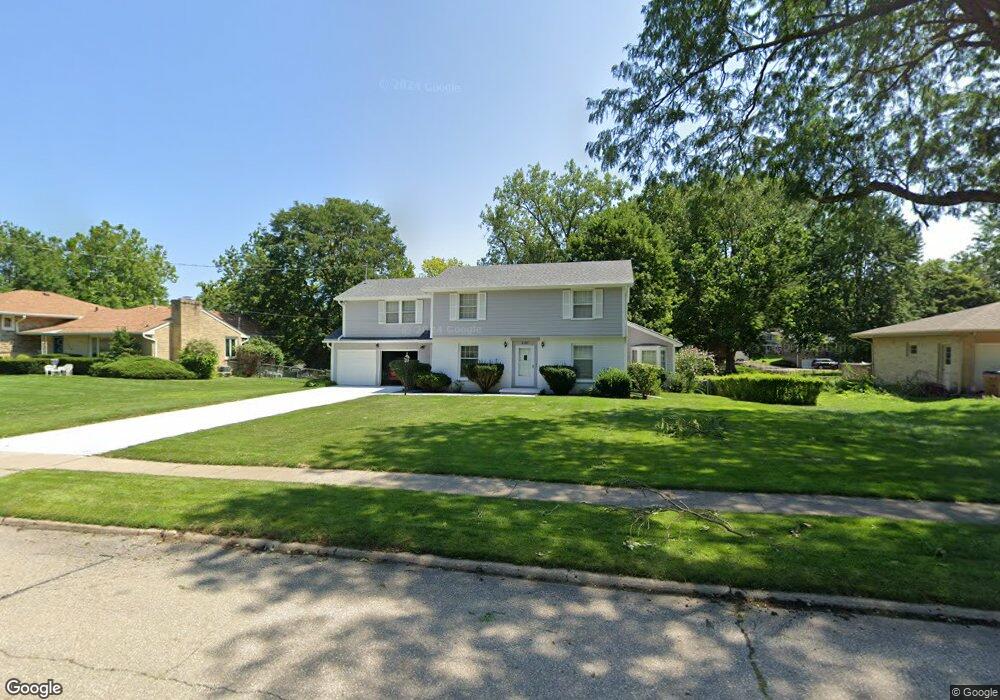
1101 24th St West Des Moines, IA 50266
Estimated Value: $314,000 - $367,804
4
Beds
3
Baths
2,495
Sq Ft
$134/Sq Ft
Est. Value
About This Home
This home is located at 1101 24th St, West Des Moines, IA 50266 and is currently estimated at $333,951, approximately $133 per square foot. 1101 24th St is a home located in Polk County with nearby schools including Fairmeadows Elementary School, Stilwell Junior High School, and Valley Southwoods Freshman High School.
Ownership History
Date
Name
Owned For
Owner Type
Purchase Details
Closed on
Mar 16, 2011
Sold by
Smith Valda E and Smith David A
Bought by
Perez Maria I
Current Estimated Value
Purchase Details
Closed on
Aug 7, 2001
Sold by
Cheney Michael R and Cheney Karen L
Bought by
Langstraat Keith E and Langstraat Marcia R
Home Financials for this Owner
Home Financials are based on the most recent Mortgage that was taken out on this home.
Original Mortgage
$100,000
Interest Rate
6.67%
Create a Home Valuation Report for This Property
The Home Valuation Report is an in-depth analysis detailing your home's value as well as a comparison with similar homes in the area
Home Values in the Area
Average Home Value in this Area
Purchase History
| Date | Buyer | Sale Price | Title Company |
|---|---|---|---|
| Perez Maria I | -- | None Available | |
| Langstraat Keith E | $181,000 | -- |
Source: Public Records
Mortgage History
| Date | Status | Borrower | Loan Amount |
|---|---|---|---|
| Previous Owner | Langstraat Keith E | $100,000 |
Source: Public Records
Tax History Compared to Growth
Tax History
| Year | Tax Paid | Tax Assessment Tax Assessment Total Assessment is a certain percentage of the fair market value that is determined by local assessors to be the total taxable value of land and additions on the property. | Land | Improvement |
|---|---|---|---|---|
| 2025 | $4,866 | $365,600 | $76,100 | $289,500 |
| 2024 | $4,866 | $324,500 | $66,700 | $257,800 |
| 2023 | $4,964 | $324,500 | $66,700 | $257,800 |
| 2022 | $4,904 | $266,000 | $56,000 | $210,000 |
| 2021 | $4,630 | $266,000 | $56,000 | $210,000 |
| 2020 | $4,556 | $239,500 | $50,300 | $189,200 |
| 2019 | $4,326 | $239,500 | $50,300 | $189,200 |
| 2018 | $4,332 | $219,700 | $45,200 | $174,500 |
| 2017 | $4,212 | $219,700 | $45,200 | $174,500 |
| 2016 | $4,116 | $207,800 | $41,900 | $165,900 |
| 2015 | $4,116 | $207,800 | $41,900 | $165,900 |
| 2014 | $3,856 | $193,100 | $38,300 | $154,800 |
Source: Public Records
Map
Nearby Homes
- 1114 22nd St
- 542 Bella St
- 1006 22nd St
- 1028 28th St
- 2408 Pleasant St
- 2013 Crown Flair Dr
- 842 23rd St
- 2100 Meadow Brook Dr Unit 103
- 1827 Pleasant St
- 1909 Prospect Ave
- 1410 20th St Unit 20
- 1010 32nd St
- 2917 Meadow Ln
- 725 20th St
- 3204 Vine St
- 1101 33rd St
- 720 19th St
- 2908 Meadow Ln
- 548 29th St
- 1230 16th St