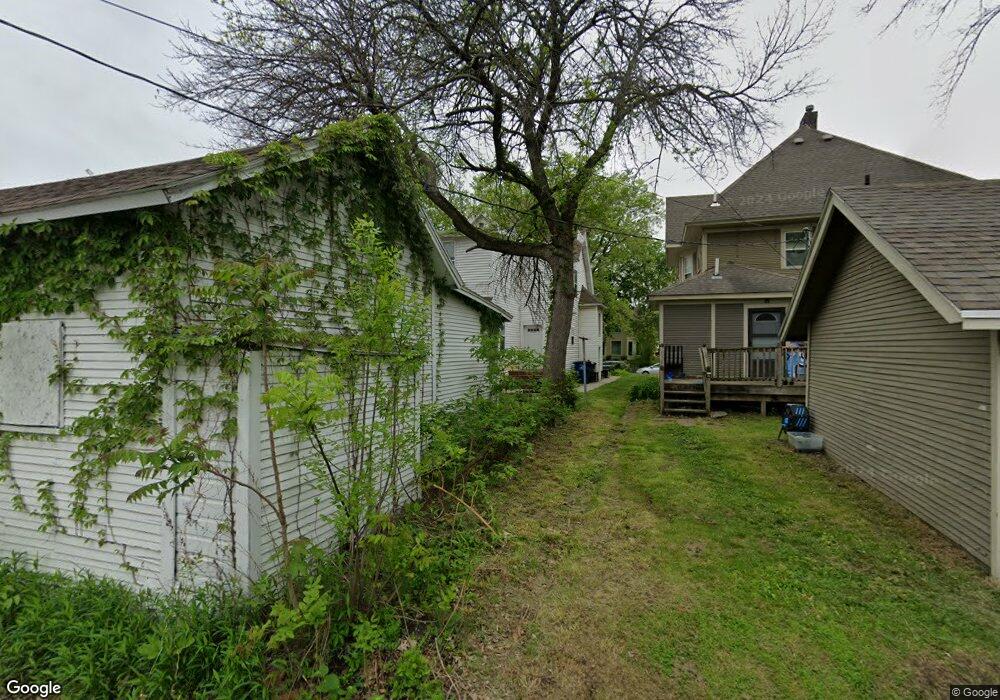
1101 26th St Des Moines, IA 50311
Drake NeighborhoodEstimated Value: $306,431 - $363,000
--
Bed
3
Baths
2,122
Sq Ft
$155/Sq Ft
Est. Value
About This Home
This home is located at 1101 26th St, Des Moines, IA 50311 and is currently estimated at $329,358, approximately $155 per square foot. 1101 26th St is a home located in Polk County with nearby schools including Hubbell Elementary and Roosevelt High School.
Ownership History
Date
Name
Owned For
Owner Type
Purchase Details
Closed on
Oct 13, 2017
Sold by
Kim Development And Construction Llc
Bought by
Hc Rentals Llc
Current Estimated Value
Purchase Details
Closed on
Oct 15, 2015
Sold by
1101 26Th Street Llc
Bought by
Klm Development And Construction Llc
Purchase Details
Closed on
Jul 28, 2015
Sold by
Greyfox Properties Llc
Bought by
1101 26Th Street Llc
Purchase Details
Closed on
Mar 16, 2015
Sold by
M2k 51 Llc
Bought by
Greyfox Properties Llc
Purchase Details
Closed on
Jan 29, 2015
Sold by
Stuart Jack H
Bought by
M2k-51 Llc and Mutual Of Omaha Bank
Create a Home Valuation Report for This Property
The Home Valuation Report is an in-depth analysis detailing your home's value as well as a comparison with similar homes in the area
Home Values in the Area
Average Home Value in this Area
Purchase History
| Date | Buyer | Sale Price | Title Company |
|---|---|---|---|
| Hc Rentals Llc | $15,000 | None Available | |
| Klm Development And Construction Llc | -- | None Available | |
| 1101 26Th Street Llc | -- | Attorney | |
| Greyfox Properties Llc | -- | None Available | |
| Greyfox Properties Llc | -- | None Available | |
| M2k-51 Llc | -- | None Available |
Source: Public Records
Tax History Compared to Growth
Tax History
| Year | Tax Paid | Tax Assessment Tax Assessment Total Assessment is a certain percentage of the fair market value that is determined by local assessors to be the total taxable value of land and additions on the property. | Land | Improvement |
|---|---|---|---|---|
| 2025 | $4,770 | $277,800 | $24,900 | $252,900 |
| 2024 | $4,770 | $242,500 | $21,400 | $221,100 |
| 2023 | $4,534 | $242,500 | $21,400 | $221,100 |
| 2022 | $4,500 | $192,400 | $17,500 | $174,900 |
| 2021 | $598 | $192,400 | $17,500 | $174,900 |
| 2020 | $670 | $20,000 | $11,400 | $8,600 |
| 2019 | $588 | $20,000 | $11,400 | $8,600 |
| 2018 | $626 | $16,600 | $11,400 | $5,200 |
| 2017 | $1,587 | $16,600 | $11,400 | $5,200 |
| 2016 | $612 | $15,000 | $9,500 | $5,500 |
| 2015 | $612 | $15,000 | $9,500 | $5,500 |
| 2014 | $5,781 | $76,000 | $9,500 | $66,500 |
Source: Public Records
Map
Nearby Homes