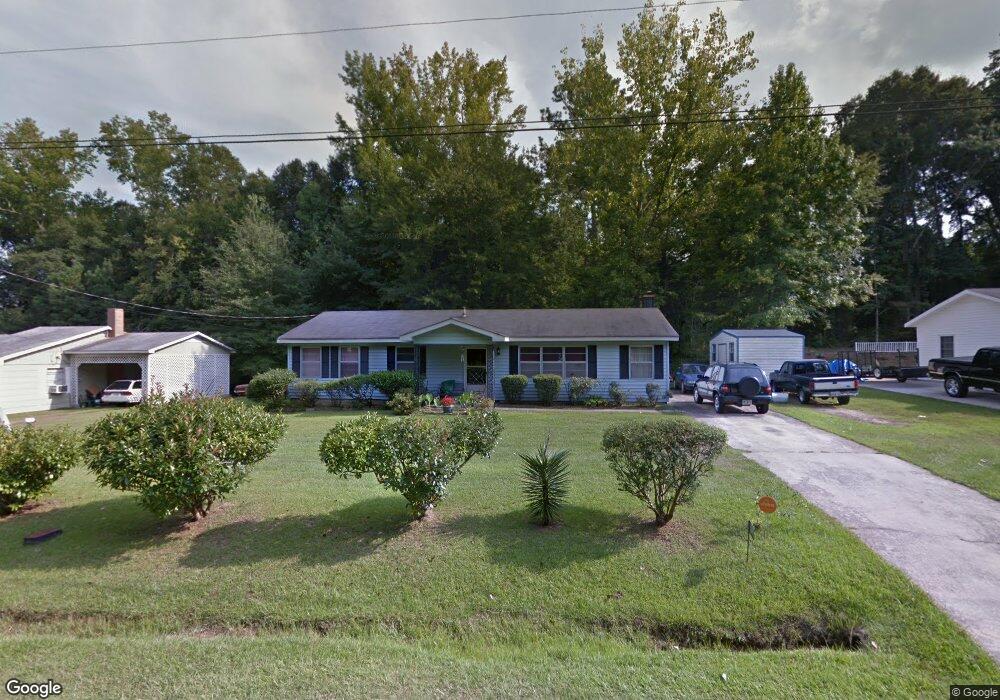
1101 Alexander St Union Point, GA 30669
Estimated Value: $166,000 - $204,000
3
Beds
2
Baths
1,300
Sq Ft
$143/Sq Ft
Est. Value
About This Home
This home is located at 1101 Alexander St, Union Point, GA 30669 and is currently estimated at $185,791, approximately $142 per square foot. 1101 Alexander St is a home located in Greene County with nearby schools including Greene County High School.
Ownership History
Date
Name
Owned For
Owner Type
Purchase Details
Closed on
Sep 12, 2002
Sold by
Hood Francis Leo
Bought by
Affidavit-Francis Hood Decease
Current Estimated Value
Purchase Details
Closed on
Jan 1, 1986
Sold by
Carter Milton
Bought by
Hood Francis Leo
Purchase Details
Closed on
Jan 1, 1985
Sold by
Fha
Bought by
Carter Milton
Purchase Details
Closed on
Jan 1, 1984
Sold by
Torrence Michael and Torrence Debra
Bought by
Fha
Purchase Details
Closed on
Jan 1, 1981
Sold by
Usa
Bought by
Torrence Michael and Torrence Debra
Purchase Details
Closed on
Jan 1, 1980
Sold by
Jones Carolyn E
Bought by
Usa
Purchase Details
Closed on
Jan 1, 1979
Sold by
Jones Robert L and Jones Carolyn E
Bought by
Jones Carolyn E
Purchase Details
Closed on
Jan 1, 1978
Sold by
Wilson W R
Bought by
Jones Robert L and Jones Carolyn E
Purchase Details
Closed on
Jan 1, 1977
Sold by
Wilson William R Etal
Bought by
Wilson W R
Purchase Details
Closed on
Jan 1, 1974
Sold by
Wilson William R Etal
Bought by
Wilson William R Etal
Create a Home Valuation Report for This Property
The Home Valuation Report is an in-depth analysis detailing your home's value as well as a comparison with similar homes in the area
Home Values in the Area
Average Home Value in this Area
Purchase History
| Date | Buyer | Sale Price | Title Company |
|---|---|---|---|
| Affidavit-Francis Hood Decease | -- | -- | |
| Hood Francis Leo | -- | -- | |
| Carter Milton | -- | -- | |
| Fha | -- | -- | |
| Torrence Michael | -- | -- | |
| Usa | -- | -- | |
| Jones Carolyn E | -- | -- | |
| Jones Robert L | -- | -- | |
| Wilson W R | -- | -- | |
| Wilson William R Etal | -- | -- |
Source: Public Records
Tax History Compared to Growth
Tax History
| Year | Tax Paid | Tax Assessment Tax Assessment Total Assessment is a certain percentage of the fair market value that is determined by local assessors to be the total taxable value of land and additions on the property. | Land | Improvement |
|---|---|---|---|---|
| 2024 | $669 | $36,960 | $4,120 | $32,840 |
| 2023 | $246 | $36,048 | $4,120 | $31,928 |
| 2022 | $373 | $33,256 | $4,120 | $29,136 |
| 2021 | $378 | $30,136 | $4,120 | $26,016 |
| 2020 | $336 | $18,480 | $2,680 | $15,800 |
| 2019 | $343 | $18,480 | $2,680 | $15,800 |
| 2018 | $204 | $18,480 | $2,680 | $15,800 |
| 2017 | $306 | $18,506 | $2,700 | $15,806 |
| 2016 | $322 | $19,150 | $2,700 | $16,450 |
| 2015 | $292 | $19,150 | $2,700 | $16,450 |
| 2014 | $282 | $18,421 | $2,700 | $15,721 |
Source: Public Records
Map
Nearby Homes
- 0 S Rhodes St Unit 10618488
- 0 Washington Hwy Unit 7276060
- 215 Hunter St
- 324 N Rhodes St
- 202 Veazey St
- 1241 Old Siloam Rd
- 1041 Hillcrest Dr
- 0 Woodland Ct Unit 10543600
- 112 Hendry St
- 1581 Highway 77 S Hwy
- 1581 Highway 77 S
- 1860 Washington Hwy
- 1251 Adams Rd
- 5401 Union Point Hwy
- 1201 Buffalo Lick Rd
- 0 Buffalo Lick Rd Unit 10551234
- 0 Buffalo Lick Rd Unit 10551325
- 0 Old Union Point Rd Unit 1 10557753
- 1251 Brick House Rd
- 1251 Brickhouse Rd
- 1091 Alexander St
- 209 Willow Ln
- 1081 Alexander St
- 0 Alexander Ave Unit LOT36 7293393
- 206 Willow Ln
- 1121 Alexander St
- 1071 Alexander St
- 1040 Parham Dr
- 1131 Alexander St
- 217 S Rhodes St
- 215 S Rhodes St
- 213 S Rhodes St
- 1041 Parham Dr
- 1061 Alexander St
- 301 S Rhodes St
- 1141 Alexander Ave
- 1141 Alexander St
- 211 S Rhodes St
- 1150 Alexander St
- 1030 Parham Dr