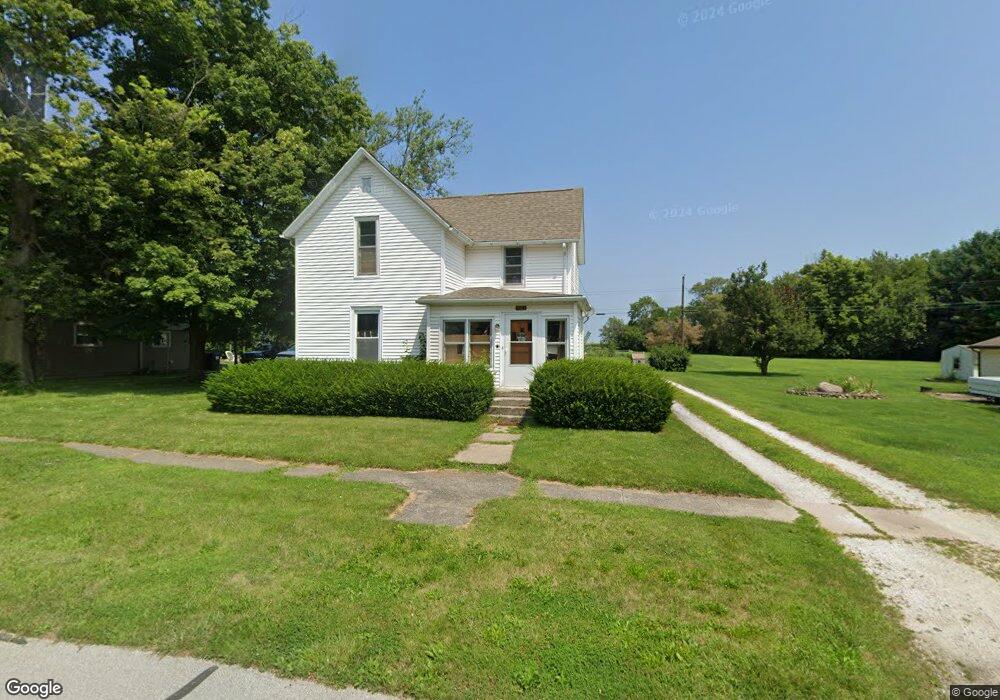
1101 E 3rd St Fowler, IN 47944
Estimated Value: $106,000 - $205,000
4
Beds
2
Baths
1,624
Sq Ft
$107/Sq Ft
Est. Value
About This Home
This home is located at 1101 E 3rd St, Fowler, IN 47944 and is currently estimated at $173,613, approximately $106 per square foot. 1101 E 3rd St is a home located in Benton County with nearby schools including Benton Central Junior/Senior High School and Sacred Heart Elementary School.
Ownership History
Date
Name
Owned For
Owner Type
Purchase Details
Closed on
Sep 21, 2022
Sold by
Sandifur Travis W
Bought by
Sandifur Pamela C and Crouch Charles R
Current Estimated Value
Home Financials for this Owner
Home Financials are based on the most recent Mortgage that was taken out on this home.
Original Mortgage
$63,000
Outstanding Balance
$56,699
Interest Rate
5.55%
Mortgage Type
New Conventional
Estimated Equity
$116,914
Purchase Details
Closed on
Apr 13, 2017
Sold by
Vanmeter Madonna and Schwartz Thomas
Bought by
Sandifur Travis W and Crouch Pamela C
Create a Home Valuation Report for This Property
The Home Valuation Report is an in-depth analysis detailing your home's value as well as a comparison with similar homes in the area
Purchase History
| Date | Buyer | Sale Price | Title Company |
|---|---|---|---|
| Sandifur Pamela C | -- | -- | |
| Sandifur Travis W | $38,000 | Benton Co Abstract & Title |
Source: Public Records
Mortgage History
| Date | Status | Borrower | Loan Amount |
|---|---|---|---|
| Open | Sandifur Pamela C | $63,000 |
Source: Public Records
Tax History
| Year | Tax Paid | Tax Assessment Tax Assessment Total Assessment is a certain percentage of the fair market value that is determined by local assessors to be the total taxable value of land and additions on the property. | Land | Improvement |
|---|---|---|---|---|
| 2025 | $2,125 | $98,000 | $12,400 | $85,600 |
| 2024 | $2,125 | $93,400 | $12,400 | $81,000 |
| 2023 | $1,906 | $83,200 | $11,100 | $72,100 |
| 2022 | $1,467 | $63,900 | $11,100 | $52,800 |
| 2021 | $1,238 | $54,000 | $11,100 | $42,900 |
| 2020 | $325 | $49,900 | $11,100 | $38,800 |
| 2019 | $285 | $48,200 | $10,600 | $37,600 |
| 2018 | $183 | $43,300 | $10,600 | $32,700 |
| 2017 | $0 | $75,500 | $10,600 | $64,900 |
| 2016 | $122 | $68,900 | $10,600 | $58,300 |
| 2014 | $118 | $62,000 | $10,400 | $51,600 |
| 2013 | $118 | $58,400 | $9,900 | $48,500 |
Source: Public Records
Map
Nearby Homes
- 1009 E 4th St
- 305 N Lincoln Ave
- 201 S Grant Ave
- 909 E 8th St
- 601 E 3rd St
- 303 N Jackson Ave
- 902 E 8th St
- 502 E 5th St
- 501 E 7th St
- 202 N Van Buren Ave
- 503 E 8th St
- 602 S Park Dr
- 307 N Madison Ave
- 700 S Sharon Ave
- 310 E 7th St
- 206 E Maple St
- 705 N Adams Ave
- 307 N Washington Ave
- 111 W 4th St
- 703 W 2nd St
Your Personal Tour Guide
Ask me questions while you tour the home.