V
Landlord's Agent in 2025
Vera Barber
Joyner Fine Properties
(804) 337-0875
16 in this area
24 Total Sales
Estimated Value: $379,664 - $417,000
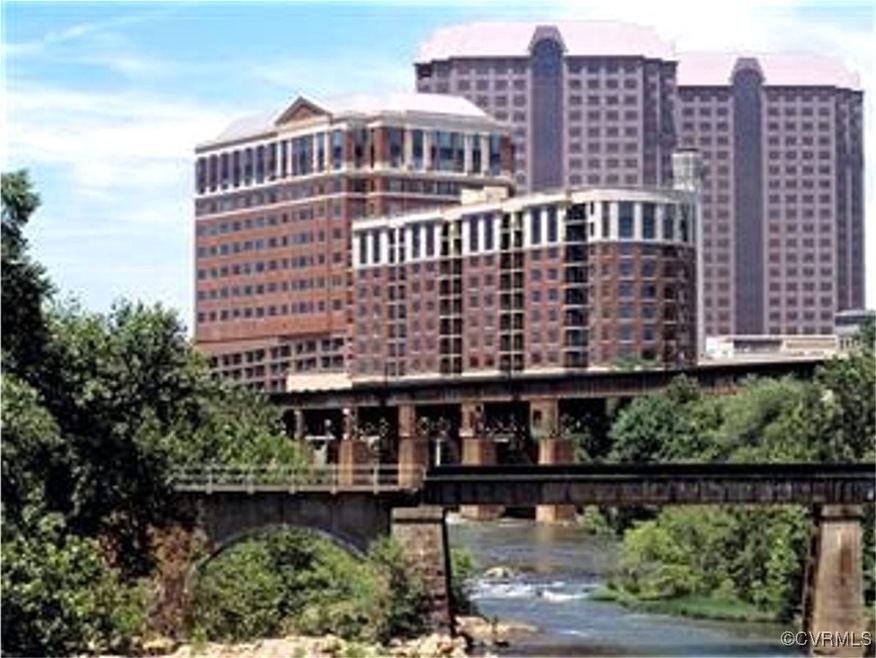
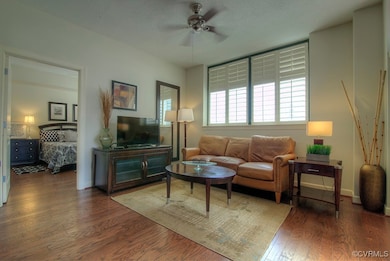
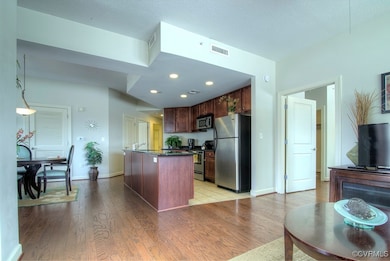
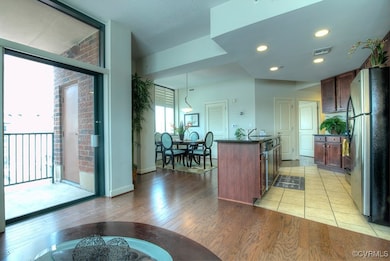
FULLY FURNISHED ALL INCLUSIVE (furniture, housewares, linens, all utilities, Comcast Xfinity cable & internet and TWO designated parking spaces 2BDR 2BA condo in Riverside on the James.
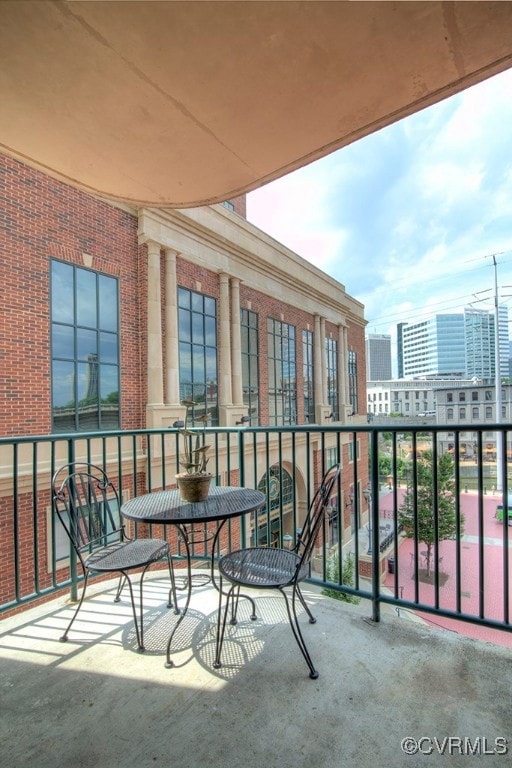
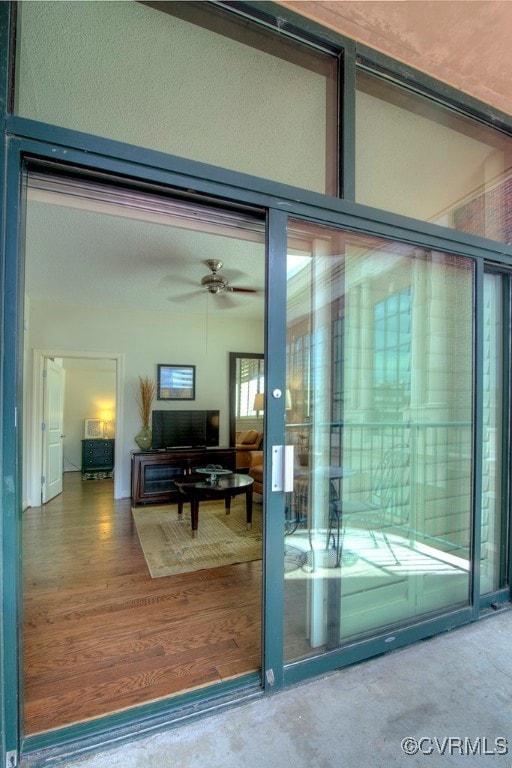
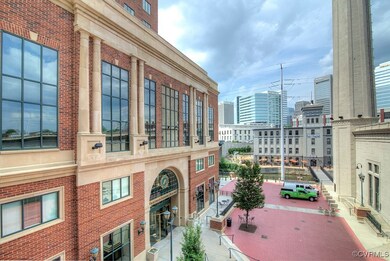
You deserve the exciting and vibrant beat of Downtown Historic Richmond on the Canal Basin. Riverside on the James built in 2005 was built ON Historic Browns Island. CORNER CONDO FACING CITY with River views from the LR & MBDR on the 3rd floor. Modern Traditional with black granite counters stainless steel appliances hardwood floors throughout 9+ foot ceiling walk in closet MBA has separate shower and tub. Includes furniture, housewares, all utilities and Owner pays monthly association dues and 2 designated parking spaces.
AVAILABLE NOW for only $110 per day (minimum 30 day stay) and a one time exit clean of $300. Call for information on rental rate for leases 3+ months.
Last Agent to Rent the Property
Joyner Fine Properties License #0225070594 Listed on: 03/10/2025
| Date | Buyer | Sale Price | Title Company |
|---|---|---|---|
| Yoon Erica | $226,925 | -- |
| Date | Status | Borrower | Loan Amount |
|---|---|---|---|
| Open | Yoon Erica | $181,540 |
| Date | Event | Price | List to Sale | Price per Sq Ft |
|---|---|---|---|---|
| 04/01/2025 04/01/25 | Rented | $3,150 | 0.0% | -- |
| 03/21/2025 03/21/25 | Under Contract | -- | -- | -- |
| 03/10/2025 03/10/25 | For Rent | $3,150 | -4.5% | -- |
| 04/12/2023 04/12/23 | Rented | $3,300 | -8.3% | -- |
| 03/12/2023 03/12/23 | For Rent | $3,600 | 0.0% | -- |
| 12/01/2022 12/01/22 | Rented | $3,600 | +14.3% | -- |
| 11/01/2022 11/01/22 | For Rent | $3,150 | -4.5% | -- |
| 11/18/2021 11/18/21 | Rented | $3,300 | +4.8% | -- |
| 11/05/2021 11/05/21 | Price Changed | $3,150 | -12.5% | $3 / Sq Ft |
| 10/31/2021 10/31/21 | For Rent | $3,600 | -- | -- |
| Year | Tax Paid | Tax Assessment Tax Assessment Total Assessment is a certain percentage of the fair market value that is determined by local assessors to be the total taxable value of land and additions on the property. | Land | Improvement |
|---|---|---|---|---|
| 2025 | $4,104 | $342,000 | $45,000 | $297,000 |
| 2024 | $4,104 | $342,000 | $45,000 | $297,000 |
| 2023 | $3,780 | $315,000 | $45,000 | $270,000 |
| 2022 | $3,348 | $279,000 | $45,000 | $234,000 |
| 2021 | $3,618 | $279,000 | $45,000 | $234,000 |
| 2020 | $3,618 | $266,000 | $56,000 | $210,000 |
| 2019 | $3,119 | $253,000 | $52,000 | $201,000 |
| 2018 | $2,553 | $235,000 | $52,000 | $183,000 |
| 2017 | $3,196 | $235,000 | $52,000 | $183,000 |
| 2016 | $1,910 | $235,000 | $52,000 | $183,000 |
| 2015 | $1,656 | $235,000 | $52,000 | $183,000 |
| 2014 | $1,656 | $240,000 | $45,000 | $195,000 |
V
Landlord's Agent in 2025
Vera Barber
Joyner Fine Properties
(804) 337-0875
16 in this area
24 Total Sales
Source: Central Virginia Regional MLS
MLS Number: 2505998
APN: E000-0001-026
Disclaimer: Certain information contained herein is derived from information provided by parties other than Homes.com. All information provided is deemed reliable, but is not guaranteed to be accurate and should be independently verified.
![]() All or a portion of th multiple Listing information is provided by the Central Virginia Regional Multiple Listing Service, LLC, from a copyrighted compilation of Listing s. All CVR MLS information provided is deemed reliable but is not guaranteed accurate. The compilation of Listings and each individual Listing are ©2025 Central Virginia Regional Multiple Listing Service, LLC. All rights reserved.
All or a portion of th multiple Listing information is provided by the Central Virginia Regional Multiple Listing Service, LLC, from a copyrighted compilation of Listing s. All CVR MLS information provided is deemed reliable but is not guaranteed accurate. The compilation of Listings and each individual Listing are ©2025 Central Virginia Regional Multiple Listing Service, LLC. All rights reserved.
