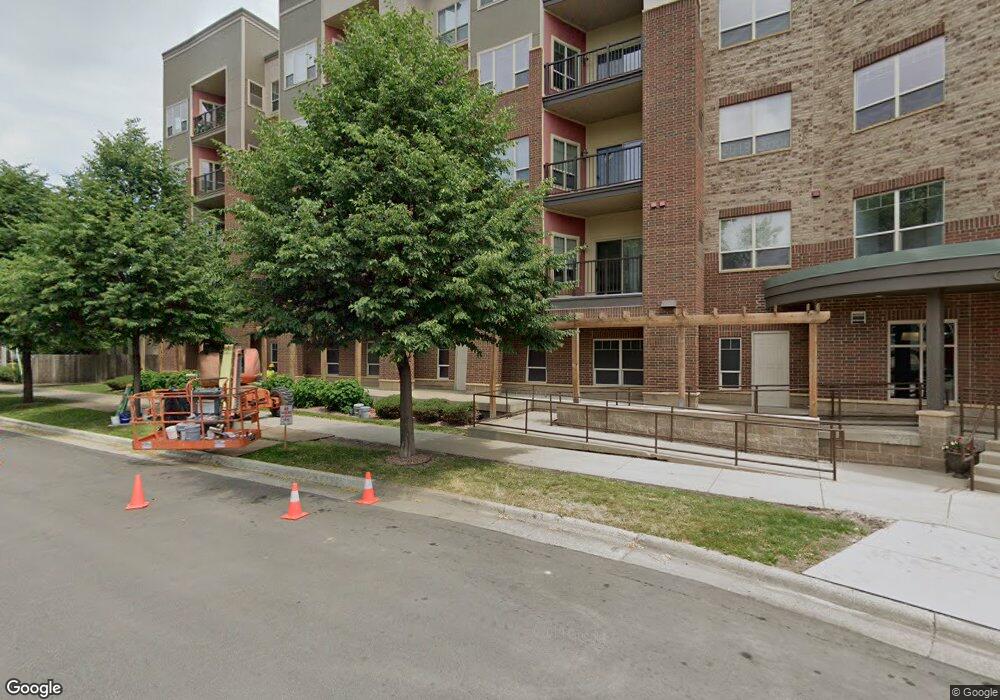
1101 Main St NE Unit 405 Minneapolis, MN 55413
Sheridan NeighborhoodEstimated Value: $227,000 - $311,000
1
Bed
2
Baths
893
Sq Ft
$299/Sq Ft
Est. Value
About This Home
This home is located at 1101 Main St NE Unit 405, Minneapolis, MN 55413 and is currently estimated at $267,110, approximately $299 per square foot. 1101 Main St NE Unit 405 is a home located in Hennepin County with nearby schools including Pillsbury Elementary School, Northeast Middle School, and Thomas Edison High School.
Ownership History
Date
Name
Owned For
Owner Type
Purchase Details
Closed on
Oct 19, 2018
Sold by
St Louis Park Place Llc
Bought by
1101 Main Llc
Current Estimated Value
Purchase Details
Closed on
Jul 29, 2016
Home Financials for this Owner
Home Financials are based on the most recent Mortgage that was taken out on this home.
Original Mortgage
$8,169,720
Interest Rate
3.48%
Purchase Details
Closed on
Apr 26, 2013
Purchase Details
Closed on
Apr 8, 2013
Sold by
Federal Home Loan Mortgage Corporation
Bought by
Catholic Eldercare Community Services Co
Purchase Details
Closed on
Apr 18, 2012
Sold by
Us Bank National Association
Bought by
Federal Home Loan Mortgage Corp
Purchase Details
Closed on
Apr 17, 2012
Sold by
Benjamin A Warpeha
Bought by
Us Bank National Association
Create a Home Valuation Report for This Property
The Home Valuation Report is an in-depth analysis detailing your home's value as well as a comparison with similar homes in the area
Home Values in the Area
Average Home Value in this Area
Purchase History
| Date | Buyer | Sale Price | Title Company |
|---|---|---|---|
| 1101 Main Llc | $12,400,000 | Servion Commercial Title | |
| -- | $10,900,000 | -- | |
| St Louis Park Place Llc | $10,644,117 | Commercial Partners Title Ll | |
| -- | $133,000 | -- | |
| Catholic Eldercare Community Services Co | -- | Title One Inc | |
| Federal Home Loan Mortgage Corp | -- | None Available | |
| Us Bank National Association | $193,910 | -- | |
| Us Bank National Association | $193,909 | None Available |
Source: Public Records
Mortgage History
| Date | Status | Borrower | Loan Amount |
|---|---|---|---|
| Previous Owner | -- | $8,169,720 |
Source: Public Records
Tax History Compared to Growth
Tax History
| Year | Tax Paid | Tax Assessment Tax Assessment Total Assessment is a certain percentage of the fair market value that is determined by local assessors to be the total taxable value of land and additions on the property. | Land | Improvement |
|---|---|---|---|---|
| 2024 | $3,049 | $205,000 | $15,000 | $190,000 |
| 2023 | $2,650 | $203,000 | $10,000 | $193,000 |
| 2022 | $2,481 | $201,000 | $10,000 | $191,000 |
| 2021 | $2,321 | $179,000 | $10,000 | $169,000 |
| 2020 | $2,442 | $173,500 | $3,400 | $170,100 |
| 2019 | $2,412 | $168,500 | $3,400 | $165,100 |
| 2018 | $2,231 | $159,000 | $3,400 | $155,600 |
| 2017 | $2,186 | $142,000 | $3,400 | $138,600 |
| 2016 | $2,203 | $138,500 | $3,400 | $135,100 |
| 2015 | $2,429 | $145,500 | $3,400 | $142,100 |
| 2014 | -- | $148,500 | $3,400 | $145,100 |
Source: Public Records
Map
Nearby Homes
- 328 13th Ave NE
- 1600 3rd St NE
- 510 University Ave NE
- 1609 4th St NE
- 1318 Washington St NE
- 1326 Washington St NE
- 1426 Washington St NE
- 604 Adams St NE
- 1716 5th St NE
- 1538 N Washington Ave
- 417 4th Ave NE
- 653 Jefferson St NE
- 714 NE Madison St
- 424 19th Ave NE
- 735 Madison St NE
- 1428 Madison St NE
- 517 River St
- 2001 University Ave NE
- 1518 Madison St NE
- 505 River St
- 1101 Main St NE
- 1101 Main St NE Unit 506
- 1101 Main St NE Unit 516
- 1101 Main St NE Unit 515
- 1101 Main St NE Unit 514
- 1101 Main St NE Unit 513
- 1101 Main St NE Unit 512
- 1101 Main St NE Unit 511
- 1101 Main St NE Unit 510
- 1101 Main St NE Unit 509
- 1101 Main St NE Unit 508
- 1101 Main St NE Unit 507
- 1101 Main St NE Unit 416
- 1101 Main St NE Unit 415
- 1101 Main St NE Unit 414
- 1101 Main St NE Unit 413
- 1101 Main St NE Unit 412
- 1101 Main St NE Unit 411
- 1101 Main St NE Unit 410
- 1101 Main St NE Unit 409