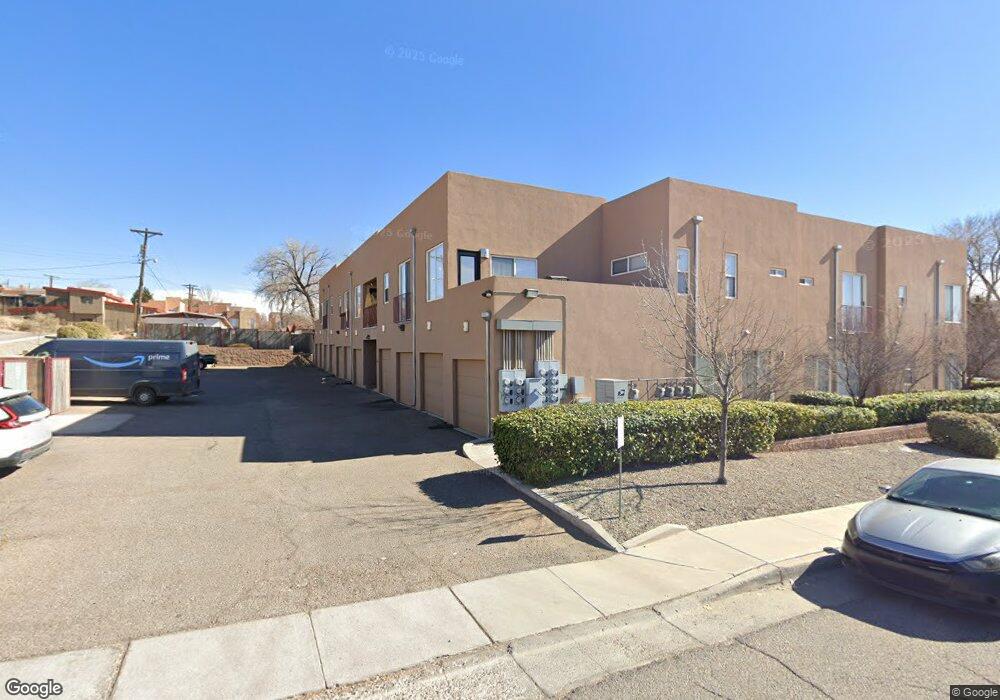
1101 Mlk Ave NE Unit 3 Albuquerque, NM 87106
Sycamore NeighborhoodEstimated Value: $204,000 - $235,000
2
Beds
2
Baths
920
Sq Ft
$236/Sq Ft
Est. Value
About This Home
This home is located at 1101 Mlk Ave NE Unit 3, Albuquerque, NM 87106 and is currently estimated at $217,570, approximately $236 per square foot. 1101 Mlk Ave NE Unit 3 is a home located in Bernalillo County with nearby schools including Monte Vista Elementary School, Jefferson Middle School, and Albuquerque High School.
Ownership History
Date
Name
Owned For
Owner Type
Purchase Details
Closed on
Dec 1, 2023
Sold by
Cone Doug and Cone Jill
Bought by
Lukes Karl Sawyer
Current Estimated Value
Home Financials for this Owner
Home Financials are based on the most recent Mortgage that was taken out on this home.
Original Mortgage
$161,000
Outstanding Balance
$157,919
Interest Rate
6.75%
Mortgage Type
New Conventional
Estimated Equity
$59,651
Purchase Details
Closed on
Aug 19, 2022
Sold by
Sandia Home Buyers Llc
Bought by
Cone Doug and Cone Jill
Purchase Details
Closed on
Aug 22, 2006
Sold by
Mulberry Gardens Llc
Bought by
Jollensten Suzanne Ellen and Foy Loren Suzanne Jollensten
Home Financials for this Owner
Home Financials are based on the most recent Mortgage that was taken out on this home.
Original Mortgage
$109,300
Interest Rate
6.75%
Mortgage Type
Purchase Money Mortgage
Create a Home Valuation Report for This Property
The Home Valuation Report is an in-depth analysis detailing your home's value as well as a comparison with similar homes in the area
Home Values in the Area
Average Home Value in this Area
Purchase History
| Date | Buyer | Sale Price | Title Company |
|---|---|---|---|
| Lukes Karl Sawyer | -- | Centric Title | |
| Cone Doug | -- | First American Title | |
| Jollensten Suzanne Ellen | -- | Fidelity National Title Insu |
Source: Public Records
Mortgage History
| Date | Status | Borrower | Loan Amount |
|---|---|---|---|
| Open | Lukes Karl Sawyer | $161,000 | |
| Previous Owner | Jollensten Suzanne Ellen | $109,300 |
Source: Public Records
Tax History Compared to Growth
Tax History
| Year | Tax Paid | Tax Assessment Tax Assessment Total Assessment is a certain percentage of the fair market value that is determined by local assessors to be the total taxable value of land and additions on the property. | Land | Improvement |
|---|---|---|---|---|
| 2024 | $2,614 | $63,960 | $0 | $63,960 |
| 2023 | $2,733 | $63,960 | $0 | $63,960 |
| 2022 | $1,884 | $44,294 | $0 | $44,294 |
| 2021 | $1,821 | $43,004 | $0 | $43,004 |
| 2020 | $1,791 | $41,752 | $0 | $41,752 |
| 2019 | $1,738 | $40,536 | $0 | $40,536 |
| 2018 | $1,676 | $40,536 | $0 | $40,536 |
| 2017 | $1,625 | $39,355 | $0 | $39,355 |
| 2016 | $1,578 | $37,096 | $0 | $37,096 |
| 2015 | $36,016 | $36,016 | $0 | $36,016 |
| 2014 | $762 | $34,967 | $0 | $34,967 |
| 2013 | -- | $0 | $0 | $0 |
Source: Public Records
Map
Nearby Homes
- 409 Ridge Place NE
- 215 Maple St NE
- 105 Maple St NE
- 422 Maple St NE
- 824 Silver Ave SE
- 1405 Sigma Chi Rd NE
- 510 Slate Ave NE
- 527 Slate Ave NE
- 609 Page Ave NE
- 1616 Sigma Chi Rd NE
- 400 Copper Ave NE Unit 201
- 339 Bel Vedere Ln NE Unit 339
- 400 Central Ave SE Unit 302
- 308 Bel Vedere Ln NE Unit 308
- 306 Bel Vedere Ln NE Unit 306
- 300 Tijeras Ave NE Unit 319
- 300 Tijeras Ave NE Unit 212
- 223 Edith Blvd SE
- 906 Franciscan St NE
- 318 Broadway Blvd NE Unit 318
- 1101 Mlk Ave NE Unit 13
- 1101 Mlk Ave NE Unit 12
- 1101 Mlk Ave NE Unit 11
- 1101 Mlk Ave NE Unit 10
- 1101 Mlk Ave NE Unit 9
- 1101 Mlk Ave NE Unit 8
- 1101 Mlk Ave NE Unit 7
- 1101 Mlk Ave NE Unit 6
- 1101 Mlk Ave NE Unit 5
- 1101 Mlk Ave NE Unit 4
- 1101 Mlk Ave NE Unit 2
- 1101 Mlk Ave NE Unit 1
- 1101 Doctor Martin Luther King Junior Ave NE Unit 9
- 1101 Doctor Martin Luther King Junior Ave NE Unit 2
- 1101 Doctor Martin Luther King Junior Ave NE Unit 7
- 1101 Doctor Martin Luther King Junior Ave NE Unit 4
- 1101 Doctor Martin Luther King Junior Ave NE Unit 11
- 1101 Doctor Martin Luther King Junior Ave NE Unit 8
- 1101 Doctor Martin Luther King Junior Ave NE Unit 6
- 1101 Martin Luther King Ave Unit 2