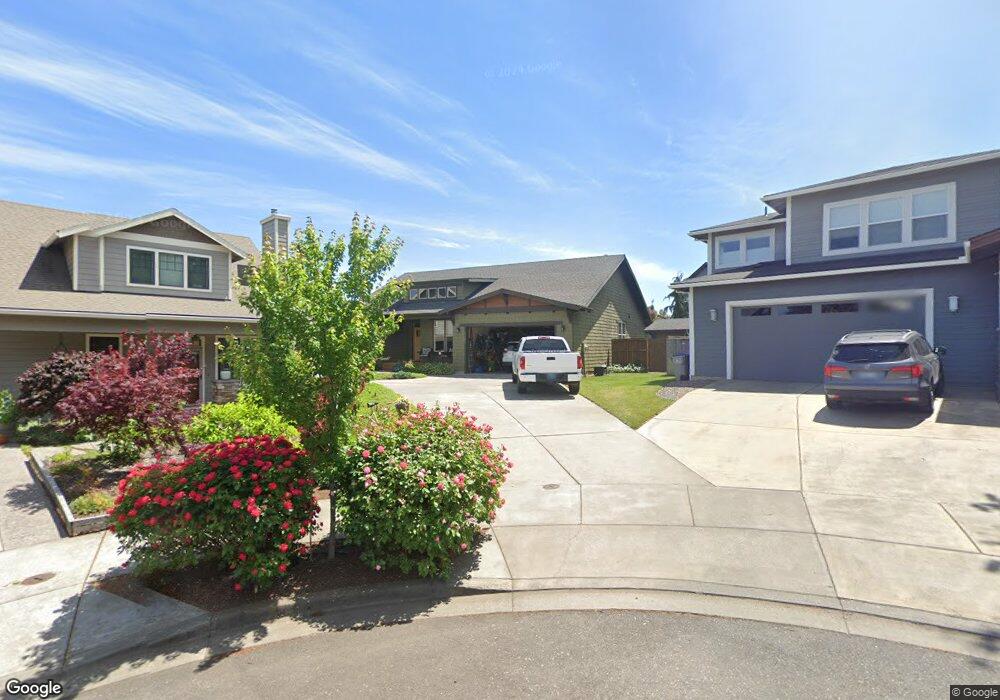
1101 Red Tail Loop Hood River, OR 97031
Estimated Value: $703,000 - $713,597
3
Beds
2
Baths
1,600
Sq Ft
$443/Sq Ft
Est. Value
About This Home
This home is located at 1101 Red Tail Loop, Hood River, OR 97031 and is currently estimated at $708,299, approximately $442 per square foot. 1101 Red Tail Loop is a home located in Hood River County with nearby schools including Westside Elementary School, Hood River Middle School, and Hood River Valley High School.
Ownership History
Date
Name
Owned For
Owner Type
Purchase Details
Closed on
Jan 8, 2024
Sold by
Griffith Gary D and Griffith Susan D
Bought by
Griffith Family Trust and Griffith
Current Estimated Value
Purchase Details
Closed on
Nov 7, 2012
Sold by
Eagle Creek Homes Llc
Bought by
Griffith Gary D and Griffith Susan D
Home Financials for this Owner
Home Financials are based on the most recent Mortgage that was taken out on this home.
Original Mortgage
$224,000
Interest Rate
3.35%
Mortgage Type
New Conventional
Purchase Details
Closed on
Aug 8, 2012
Sold by
Eagle Creek Homes Llc
Bought by
Heighton Kent S and Heighton Paul
Purchase Details
Closed on
Aug 1, 2012
Sold by
Heighton Kent S and Heighton Paul
Bought by
Eagle Creek Homes Llc
Purchase Details
Closed on
Oct 31, 2011
Sold by
Nhbs Development Group Llc
Bought by
Heighton Kent S and Heighton Paul
Create a Home Valuation Report for This Property
The Home Valuation Report is an in-depth analysis detailing your home's value as well as a comparison with similar homes in the area
Purchase History
| Date | Buyer | Sale Price | Title Company |
|---|---|---|---|
| Griffith Family Trust | -- | None Listed On Document | |
| Griffith Gary D | $304,479 | Amerititle | |
| Heighton Kent S | -- | Ameri Title | |
| Eagle Creek Homes Llc | $106,000 | Ameri Title | |
| Heighton Kent S | $90,000 | Amerititle |
Source: Public Records
Mortgage History
| Date | Status | Borrower | Loan Amount |
|---|---|---|---|
| Previous Owner | Griffith Gary D | $224,000 |
Source: Public Records
Tax History
| Year | Tax Paid | Tax Assessment Tax Assessment Total Assessment is a certain percentage of the fair market value that is determined by local assessors to be the total taxable value of land and additions on the property. | Land | Improvement |
|---|---|---|---|---|
| 2025 | $4,360 | $292,210 | $163,670 | $128,540 |
| 2024 | $4,245 | $283,700 | $158,900 | $124,800 |
| 2023 | $4,245 | $275,440 | $154,270 | $121,170 |
| 2022 | $3,923 | $267,420 | $112,120 | $155,300 |
| 2021 | $3,941 | $259,640 | $108,860 | $150,780 |
| 2020 | $3,811 | $252,080 | $105,690 | $146,390 |
| 2019 | $3,555 | $244,740 | $102,610 | $142,130 |
| 2018 | $3,591 | $237,620 | $99,620 | $138,000 |
| 2017 | $3,441 | $225,170 | $92,270 | $132,900 |
| 2016 | $3,354 | $218,620 | $89,590 | $129,030 |
| 2015 | $3,295 | $212,260 | $86,980 | $125,280 |
| 2014 | $3,244 | $206,080 | $84,450 | $121,630 |
| 2013 | -- | $192,190 | $81,990 | $110,200 |
Source: Public Records
Map
Nearby Homes
- 1250 29th St
- 1110 Red Tail Loop
- 913 Falcon Ct
- 1110 Rock Creek Rd
- 1102 Rock Creek Rd
- 1106 Rock Creek Rd
- 1116 Rock Creek Rd
- 3653 Park Place
- 2455 Belmont Dr
- 909 Nina Ln
- 3940 Carr Dr Unit LOT 3
- 3940 Carr Dr Unit LOT 2
- 1749 22nd St
- 0 Carr Dr Unit Lot 1
- 570 Toms Dr
- 1826 Armadale Ave
- 4069 Post Canyon Dr
- 1807 Columbia St
- 1510 Lincoln St
- 1534 Lincoln St
- 1101 Redtail Loop
- 1035 Redtail Loop
- 1035 Red Tail Loop
- 1109 Redtail Loop
- 1109 Redtail Loop Unit 21
- 1109 Red Tail Loop
- 2912 Talon Ave
- 2926 Talon Ave
- 2926 Talon Ave Unit 15
- 1105 29th St
- 1115 Redtail Loop Unit 20
- 1115 Redtail Loop
- 1031 Red Tail Loop
- 1031 Redtail Loop
- 2934 Talon Ave Unit 16
- 2934 Talon Ave
- 2946 Talon Ave
- 2946 Talon Ave Unit 17
- 1110 Redtail Loop
- 1027 Redtail Loop
Your Personal Tour Guide
Ask me questions while you tour the home.