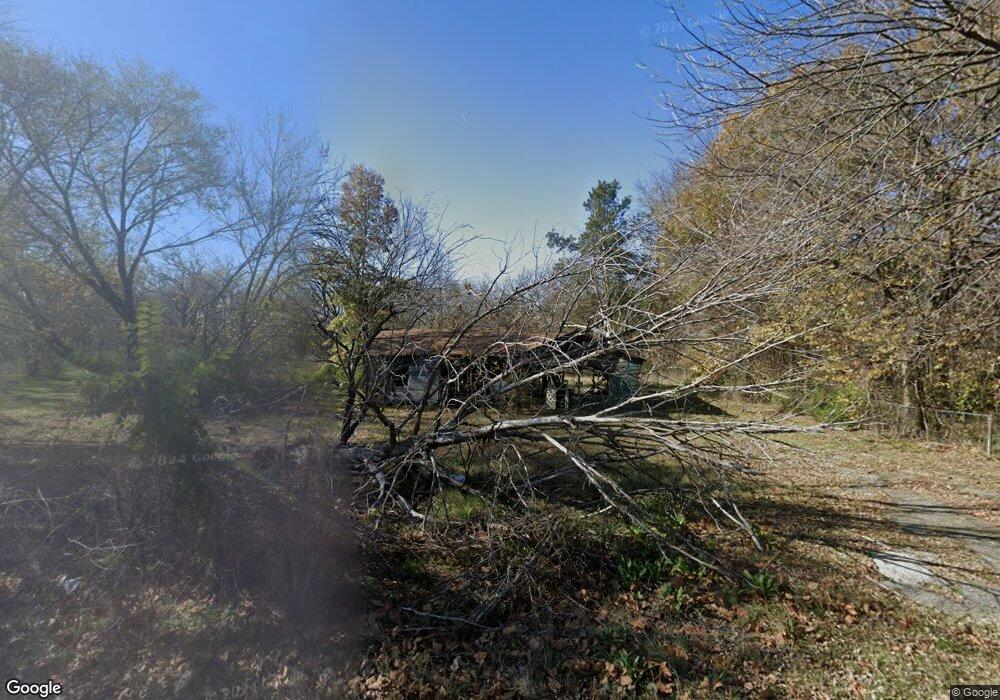
1101 S 7th St Henryetta, OK 74437
Estimated Value: $50,000 - $241,000
1
Bed
1
Bath
1,176
Sq Ft
$113/Sq Ft
Est. Value
About This Home
This home is located at 1101 S 7th St, Henryetta, OK 74437 and is currently estimated at $133,333, approximately $113 per square foot. 1101 S 7th St is a home located in Okmulgee County with nearby schools including Henryetta Elementary School, Henryetta Middle School, and Henryetta High School.
Ownership History
Date
Name
Owned For
Owner Type
Purchase Details
Closed on
Aug 11, 2025
Sold by
Nelson Jewett and Nelson Lori
Bought by
Silkwood Scotty Jo
Current Estimated Value
Home Financials for this Owner
Home Financials are based on the most recent Mortgage that was taken out on this home.
Original Mortgage
$98,330
Outstanding Balance
$98,202
Interest Rate
6.67%
Mortgage Type
New Conventional
Estimated Equity
$35,131
Purchase Details
Closed on
Jul 24, 2025
Sold by
Henderson Angela and Henderson Kevin
Bought by
Jewett Nelson
Home Financials for this Owner
Home Financials are based on the most recent Mortgage that was taken out on this home.
Original Mortgage
$98,330
Outstanding Balance
$98,202
Interest Rate
6.67%
Mortgage Type
New Conventional
Estimated Equity
$35,131
Purchase Details
Closed on
Aug 30, 2016
Sold by
Henderson Kevin
Bought by
Nelson Jewett
Purchase Details
Closed on
Apr 17, 2015
Sold by
Walker Timothy L
Bought by
Henderson Kevin Leo and Henderson Angela Michelle
Purchase Details
Closed on
Nov 12, 2014
Sold by
Kellogg Jeff and Kellogg Karen
Bought by
Walker Timothy L
Purchase Details
Closed on
Dec 11, 2012
Sold by
Sherrill Joseph R and Lee Pamela G
Bought by
Kellogg Jeff and Kellogg Karen
Purchase Details
Closed on
Jun 20, 2012
Sold by
Silkwood Kevin
Bought by
Lee Pamela G and Saerrill Joseph R
Purchase Details
Closed on
Jan 21, 2009
Sold by
Brinkley Ralph and Silkwood Glenda
Bought by
Silkwood Kevin
Home Financials for this Owner
Home Financials are based on the most recent Mortgage that was taken out on this home.
Original Mortgage
$11,880
Interest Rate
5.13%
Mortgage Type
Unknown
Create a Home Valuation Report for This Property
The Home Valuation Report is an in-depth analysis detailing your home's value as well as a comparison with similar homes in the area
Home Values in the Area
Average Home Value in this Area
Purchase History
| Date | Buyer | Sale Price | Title Company |
|---|---|---|---|
| Silkwood Scotty Jo | $10,000 | Westcor Land Title | |
| Jewett Nelson | -- | None Listed On Document | |
| Nelson Jewett | $3,500 | None Available | |
| Henderson Kevin Leo | -- | None Available | |
| Walker Timothy L | -- | -- | |
| Kellogg Jeff | $2,500 | None Available | |
| Lee Pamela G | -- | None Available | |
| Silkwood Kevin | -- | None Available |
Source: Public Records
Mortgage History
| Date | Status | Borrower | Loan Amount |
|---|---|---|---|
| Open | Silkwood Scotty Jo | $98,330 | |
| Previous Owner | Silkwood Kevin | $11,880 |
Source: Public Records
Tax History
| Year | Tax Paid | Tax Assessment Tax Assessment Total Assessment is a certain percentage of the fair market value that is determined by local assessors to be the total taxable value of land and additions on the property. | Land | Improvement |
|---|---|---|---|---|
| 2025 | $37 | $346 | $300 | $46 |
| 2024 | $35 | $346 | $300 | $46 |
| 2023 | $32 | $331 | $300 | $31 |
| 2022 | $31 | $315 | $300 | $15 |
| 2021 | $30 | $300 | $300 | $0 |
| 2020 | $30 | $300 | $300 | $0 |
| 2019 | $29 | $300 | $300 | $0 |
| 2018 | $63 | $642 | $300 | $342 |
| 2017 | $117 | $1,189 | $300 | $889 |
| 2016 | $355 | $3,601 | $300 | $3,301 |
| 2015 | $305 | $3,858 | $300 | $3,558 |
| 2014 | -- | $3,559 | $300 | $3,259 |
Source: Public Records
Map
Nearby Homes
- 311 W Madison St
- 205 W Washington St
- 902 S Lake Rd
- 104500 S 4095 Rd
- 1209 W Ragan St
- 29815 Dustin Rd
- 0 E Corporation St
- 201 E Main St
- 2201 W Main St
- 901 W Gentry St
- 605 W Cummings St
- 303 W Cummings St
- 30245 S 210 Rd
- 214 N B St
- 112 W Merrick St
- 12780 New Lake Rd
- 1215 Wade Wells Dr
- 612 NE 1st St
- 207 E Smith St
- 402336 E1100 Rd
- 1105 S 7th St
- 1107 S 7th St
- 1009 S 7th St
- 612 W Madison St
- 607 W Madison St
- 1008 S 7th St
- 612 W Jefferson St
- 1007 S 7th St
- 608 W Madison St
- 605 W Madison St
- 606 W Jefferson St
- 701 W Jefferson St
- 609 W Barclay St
- 601 W Madison St
- 1203 S 6th St
- 611 W Jefferson St
- 607 W Barclay St
- 1205 S 6th St
- 1009 S 6th St
- 605 W Barclay St
Your Personal Tour Guide
Ask me questions while you tour the home.