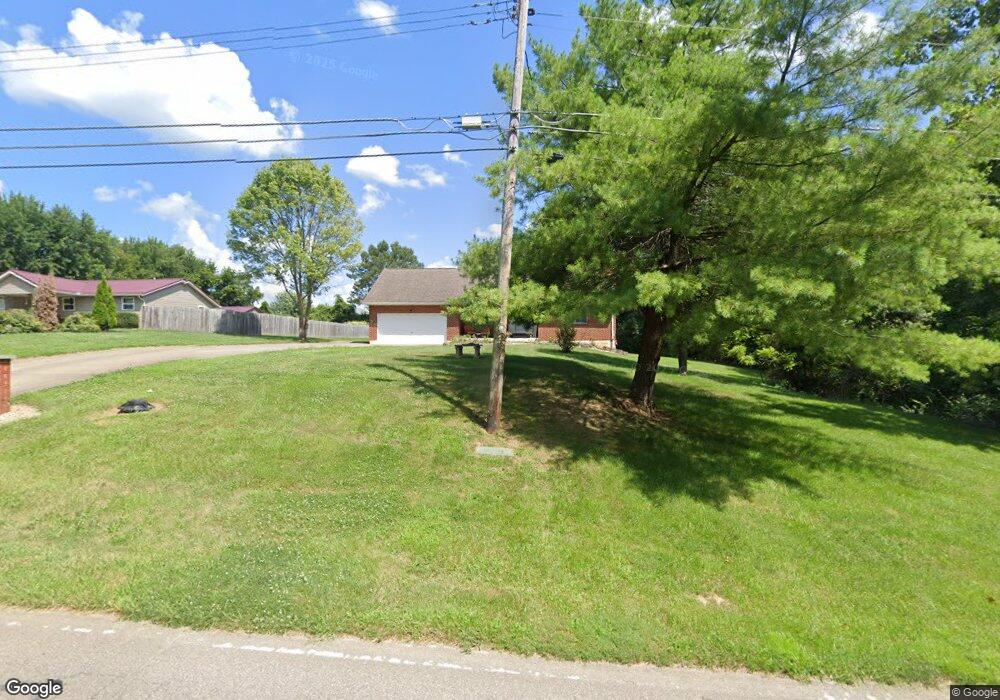
1101 Shawhan Rd Morrow, OH 45152
Estimated Value: $371,000 - $510,000
About This Home
This home is located at 1101 Shawhan Rd, Morrow, OH 45152 and is currently estimated at $417,113, approximately $237 per square foot. 1101 Shawhan Rd is a home located in Warren County with nearby schools including Kings Junior High School and Kings High School.
Ownership History
We collect this data history from publicly available records. To have your information removed, we recommend requesting removal directly through your county’s website.
Purchase Details
Purchase Details
Home Financials for this Owner
Home Financials are based on the most recent Mortgage that was taken out on this home.Purchase Details
Purchase Details
Purchase Details
Home Values in the Area
Average Home Value in this Area
Purchase History
We collect this data history from publicly available records. To have your information removed, we recommend requesting removal directly through your county’s website.
| Date | Buyer | Sale Price | Title Company |
|---|---|---|---|
| $249,450 | None Listed On Document | ||
| $249,450 | None Listed On Document | ||
| $225,000 | None Available | ||
| $333 | -- | ||
| $5,000 | -- | ||
| -- | -- |
Mortgage History
We collect this data history from publicly available records. To have your information removed, we recommend requesting removal directly through your county’s website.
| Date | Status | Borrower | Loan Amount |
|---|---|---|---|
| Previous Owner | $213,750 |
Tax History
We collect this data history from publicly available records. To have your information removed, we recommend requesting removal directly through your county’s website.
| Year | Tax Paid | Tax Assessment Tax Assessment Total Assessment is a certain percentage of the fair market value that is determined by local assessors to be the total taxable value of land and additions on the property. | Land | Improvement |
|---|---|---|---|---|
| 2025 | $5,328 | $103,700 | $21,880 | $81,820 |
| 2024 | $5,328 | $103,700 | $21,880 | $81,820 |
| 2023 | $4,679 | $81,858 | $10,587 | $71,270 |
| 2022 | $4,627 | $81,858 | $10,588 | $71,271 |
| 2021 | $3,874 | $81,858 | $10,588 | $71,271 |
| 2020 | $3,827 | $67,652 | $8,750 | $58,902 |
| 2019 | $3,942 | $67,652 | $8,750 | $58,902 |
| 2018 | $3,890 | $67,652 | $8,750 | $58,902 |
| 2017 | $4,253 | $64,253 | $8,449 | $55,804 |
| 2016 | $4,005 | $64,253 | $8,449 | $55,804 |
| 2015 | $3,621 | $64,253 | $8,449 | $55,804 |
| 2014 | $3,578 | $60,050 | $7,900 | $52,150 |
| 2013 | $3,573 | $66,540 | $8,750 | $57,790 |
Map
- 928 Shawhan Rd
- 946 Lavender Way
- 952 Lavender Way
- 3205 Garden View Ct
- 1017 Garden View Cir
- 802 Monarch Ct
- 998 Larkspur Dr
- 962 Larkspur Dr
- 3167 Rosemary Ct
- 3159 Rosemary Ct
- 3180 Sage Ct
- 507 Shawhan Rd
- 376 Shepherds Way
- 321 Shepherds Way
- 771 Mary Lane Extension
- 439 Morrow Rd Unit 49
- 439 Morrow Rd Unit 109
- 439 Morrow Rd Unit 180
- 439 Morrow Rd Unit 206
- 244 S Mary Ellen St
- 1109 Shawhan Rd
- 1073 Shawhan Rd
- 1117 Shawhan Rd
- 1129 Shawhan Rd
- 1063 Shawhan Rd
- 1117 Cheyenne Ct
- 1139 Shawhan Rd
- 1062 Shawhan Rd
- 1116 Shawhan Rd
- 1053 Shawhan Rd
- 1090 Shawnee Dr
- 1189 Shawhan Rd
- 1149 Shawhan Rd
- 1041 Shawhan Rd
- 1140 Cheyenne Ct
- 1094 Shawnee Dr
- 1094 Shawnee Dr Unit 3
- 36 Cheyenne Ct
- 1033 Shawhan Rd
- 38 Cheyenne Ct
Ask me questions while you tour the home.