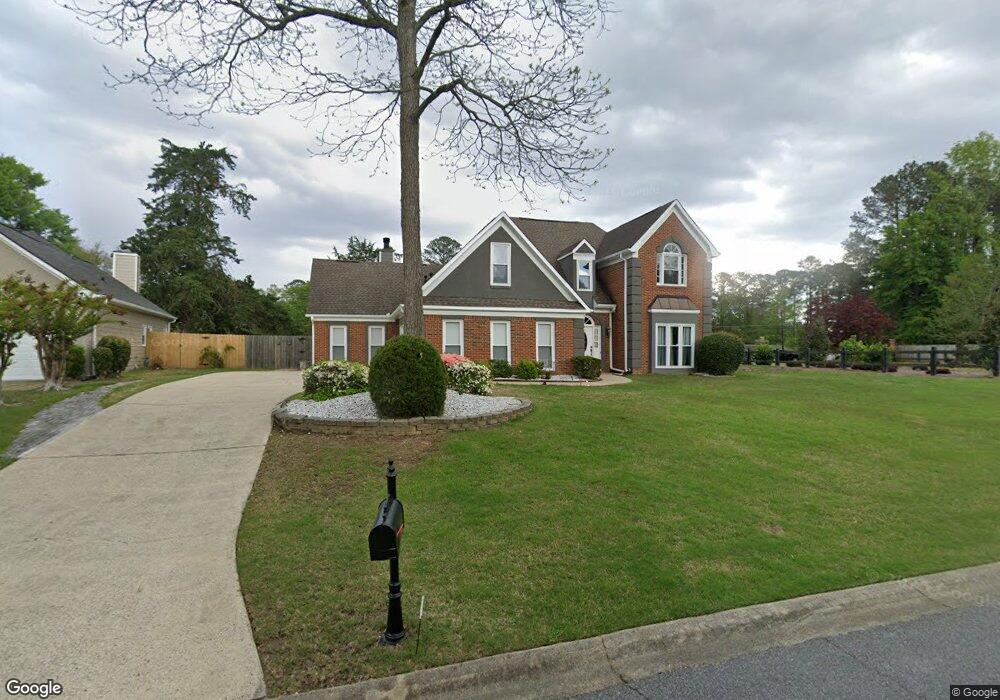
1101 Wynford Commons SW Unit 1 Marietta, GA 30064
West Cobb NeighborhoodEstimated Value: $459,000 - $526,000
4
Beds
3
Baths
2,505
Sq Ft
$191/Sq Ft
Est. Value
About This Home
This home is located at 1101 Wynford Commons SW Unit 1, Marietta, GA 30064 and is currently estimated at $478,021, approximately $190 per square foot. 1101 Wynford Commons SW Unit 1 is a home located in Cobb County with nearby schools including Dowell Elementary School, Lovinggood Middle School, and Hillgrove High School.
Ownership History
Date
Name
Owned For
Owner Type
Purchase Details
Closed on
Sep 29, 2020
Sold by
Dean Greg and Dean Gregory
Bought by
Narang Manish Prakash
Current Estimated Value
Home Financials for this Owner
Home Financials are based on the most recent Mortgage that was taken out on this home.
Original Mortgage
$256,000
Outstanding Balance
$227,183
Interest Rate
2.9%
Mortgage Type
New Conventional
Estimated Equity
$250,838
Purchase Details
Closed on
Nov 2, 2007
Sold by
Mullings Neville and Mullings Icylyn E
Bought by
Dean Greg
Home Financials for this Owner
Home Financials are based on the most recent Mortgage that was taken out on this home.
Original Mortgage
$202,850
Interest Rate
6.26%
Mortgage Type
FHA
Purchase Details
Closed on
Jun 24, 2003
Sold by
Younce George L and Younce Terri L
Bought by
Mullings Neville and Mullings Icylyn
Home Financials for this Owner
Home Financials are based on the most recent Mortgage that was taken out on this home.
Original Mortgage
$188,900
Interest Rate
5.16%
Mortgage Type
New Conventional
Purchase Details
Closed on
Oct 29, 1996
Sold by
Hagan Richard J Lori
Bought by
Younge George L
Create a Home Valuation Report for This Property
The Home Valuation Report is an in-depth analysis detailing your home's value as well as a comparison with similar homes in the area
Home Values in the Area
Average Home Value in this Area
Purchase History
| Date | Buyer | Sale Price | Title Company |
|---|---|---|---|
| Narang Manish Prakash | $320,000 | None Available | |
| Dean Greg | $206,100 | -- | |
| Mullings Neville | $198,900 | -- | |
| Younge George L | $136,000 | -- |
Source: Public Records
Mortgage History
| Date | Status | Borrower | Loan Amount |
|---|---|---|---|
| Open | Narang Manish Prakash | $256,000 | |
| Previous Owner | Dean Greg | $202,850 | |
| Previous Owner | Mullings Neville | $188,900 | |
| Closed | Younge George L | $0 |
Source: Public Records
Tax History Compared to Growth
Tax History
| Year | Tax Paid | Tax Assessment Tax Assessment Total Assessment is a certain percentage of the fair market value that is determined by local assessors to be the total taxable value of land and additions on the property. | Land | Improvement |
|---|---|---|---|---|
| 2025 | $5,090 | $201,456 | $34,000 | $167,456 |
| 2024 | $5,094 | $201,456 | $34,000 | $167,456 |
| 2023 | $3,651 | $159,940 | $34,000 | $125,940 |
| 2022 | $3,903 | $128,612 | $26,000 | $102,612 |
| 2021 | $3,573 | $117,740 | $21,600 | $96,140 |
| 2020 | $2,646 | $101,220 | $21,600 | $79,620 |
| 2019 | $2,646 | $101,220 | $21,600 | $79,620 |
| 2018 | $2,646 | $101,220 | $21,600 | $79,620 |
| 2017 | $2,228 | $87,420 | $21,600 | $65,820 |
| 2016 | $2,230 | $87,420 | $21,600 | $65,820 |
| 2015 | $1,906 | $73,544 | $21,660 | $51,884 |
| 2014 | $1,923 | $73,544 | $0 | $0 |
Source: Public Records
Map
Nearby Homes
- 1237 Wynford Woods SW
- 3033 Addie Pond Way SW
- 3072 Addie Pond Way SW
- 1209 Wilkes Way SW Unit 1
- 1331 Wynford Chase SW Unit 1
- 3003 Lawson Dr
- 1274 Wynford Colony SW
- 2722 Sandy Irwin Ct SW
- 1518 Sage Ridge Dr
- 2563 Irwin Lake Overlook Rd SW
- 2613 Lakefield Ct
- 3028 Hallman Cir SW
- 946 Steadman Terrace SW
- 1239 Bonshaw Trail Unit 3
- 1555 Vine Leaf Dr
- 1204 Commonwealth Ave SW
- 1227 Bonshaw Trail
- 2403 Bonshaw Ln
- 3061 Hallman Cir SW
- 1214 Bonshaw Trail
- 1101 Wynford Commons South W
- 1099 Wynford Commons SW Unit 2
- W W Sandtown Rd SW Unit 126
- W W Sandtown Rd SW
- S Wynford Commons South W
- 2853 Wynford Dr SW
- 1097 Wynford Commons SW
- 1097 Wynford Commons SW
- 1103 Wynford Commons SW
- 1103 Wynford Commons SW
- 1251 W Sandtown Rd SW
- 1261 W Sandtown Rd SW
- 1241 W Sandtown Rd SW
- 1098 Wynford Commons SW
- 2852 Wynford Dr SW Unit 1
- 2710 Wynford Drive South W
- 2855 Wynford Dr SW
- 1271 W Sandtown Rd SW
- 1238 Wynford Woods SW
- 0 Wynford Commons SW Unit 8825896