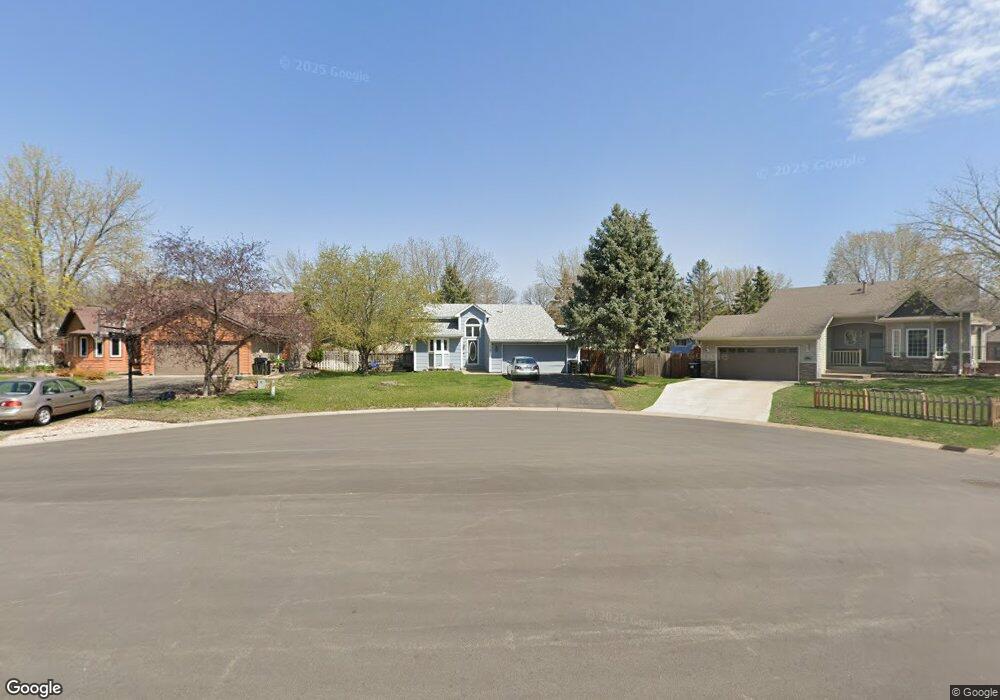
11011 Rhode Island Cir N Champlin, MN 55316
Estimated Value: $335,000 - $370,000
3
Beds
2
Baths
1,040
Sq Ft
$339/Sq Ft
Est. Value
About This Home
This home is located at 11011 Rhode Island Cir N, Champlin, MN 55316 and is currently estimated at $353,056, approximately $339 per square foot. 11011 Rhode Island Cir N is a home located in Hennepin County with nearby schools including Oxbow Creek Elementary School, Jackson Middle School, and Champlin Park High School.
Ownership History
Date
Name
Owned For
Owner Type
Purchase Details
Closed on
Jun 4, 2020
Sold by
Dabruzzi Robert R and Dabruzzi Kristina J
Bought by
Smedsrud Jeremiah and Smedsrud Mandy
Current Estimated Value
Home Financials for this Owner
Home Financials are based on the most recent Mortgage that was taken out on this home.
Original Mortgage
$250,745
Outstanding Balance
$222,681
Interest Rate
3.3%
Mortgage Type
New Conventional
Estimated Equity
$130,375
Purchase Details
Closed on
Jun 29, 2009
Sold by
Saxon Mortgage Services Inc
Bought by
Dabruzzi Robert R and Dabruzzi Kristiana J
Purchase Details
Closed on
Nov 16, 2006
Sold by
Nylin Richard A and Nylin Mary A
Bought by
Ramoni Adeola
Purchase Details
Closed on
Aug 27, 1998
Sold by
Beck William J and Beck Jeanette L
Bought by
Nylin Richard A and Nylin Mary A
Create a Home Valuation Report for This Property
The Home Valuation Report is an in-depth analysis detailing your home's value as well as a comparison with similar homes in the area
Home Values in the Area
Average Home Value in this Area
Purchase History
| Date | Buyer | Sale Price | Title Company |
|---|---|---|---|
| Smedsrud Jeremiah | $258,500 | All American Title Co Inc | |
| Dabruzzi Robert R | $155,000 | -- | |
| Ramoni Adeola | $222,000 | -- | |
| Nylin Richard A | $121,000 | -- |
Source: Public Records
Mortgage History
| Date | Status | Borrower | Loan Amount |
|---|---|---|---|
| Open | Smedsrud Jeremiah | $250,745 |
Source: Public Records
Tax History
| Year | Tax Paid | Tax Assessment Tax Assessment Total Assessment is a certain percentage of the fair market value that is determined by local assessors to be the total taxable value of land and additions on the property. | Land | Improvement |
|---|---|---|---|---|
| 2024 | $5,182 | $345,800 | $103,000 | $242,800 |
| 2023 | $5,061 | $334,700 | $93,000 | $241,700 |
| 2022 | $3,261 | $332,000 | $91,000 | $241,000 |
| 2021 | $3,037 | $269,000 | $80,000 | $189,000 |
| 2020 | $2,999 | $251,000 | $71,000 | $180,000 |
| 2019 | $2,898 | $243,000 | $73,000 | $170,000 |
| 2018 | $2,458 | $232,000 | $66,000 | $166,000 |
| 2017 | $2,220 | $180,000 | $45,000 | $135,000 |
| 2016 | $2,183 | $172,000 | $50,000 | $122,000 |
| 2015 | $2,052 | $163,000 | $41,000 | $122,000 |
| 2014 | -- | $152,000 | $41,000 | $111,000 |
Source: Public Records
Map
Nearby Homes
- 11229 Quebec Ave N
- 11210 Utah Ave N
- 11201 Maryland Ave N
- 11340 Oregon Ave N
- 10633 Sumter Ave N
- 8458 S Pond Trail Unit 26
- 8541 S Pond Trail
- 10803 Jersey Dr N
- 10987 Brittany Dr N
- 11477 Marketplace Dr N
- 11177 Edgewood Cir N
- 10357 Louisiana Ave N
- 6710 115th 1 2 Ave N
- 10512 Florida Ave N
- 11492 Elmwood Ave N
- 11421 Elmwood Ave N Unit 9
- 11462 Elmwood Ave N Unit 164
- 8333 Emery Pkwy N
- 7809 119th Ave N
- 9200 Lakeside Trail
- 11015 Rhode Island Cir N
- 11009 Rhode Island Cir N
- 7607 110th Place N
- 7605 110th Place N
- 7613 7613 110th-Place-n
- 7613 110th Place N
- 11020 Rhode Island Cir N
- 7619 110th Place N
- 11043 Quebec Ave N
- 11045 Quebec Ave N
- 11037 Quebec Ave N
- 11031 Quebec Ave N
- 11016 Rhode Island Cir N
- 11012 Rhode Island Cir N
- 11000 Rhode Island Cir N
- 11023 Quebec Ave N
- 7703 110th Place N
- 11005 Rhode Island Cir N
- 11017 Quebec Ave N
- 7606 110th Place N
Your Personal Tour Guide
Ask me questions while you tour the home.