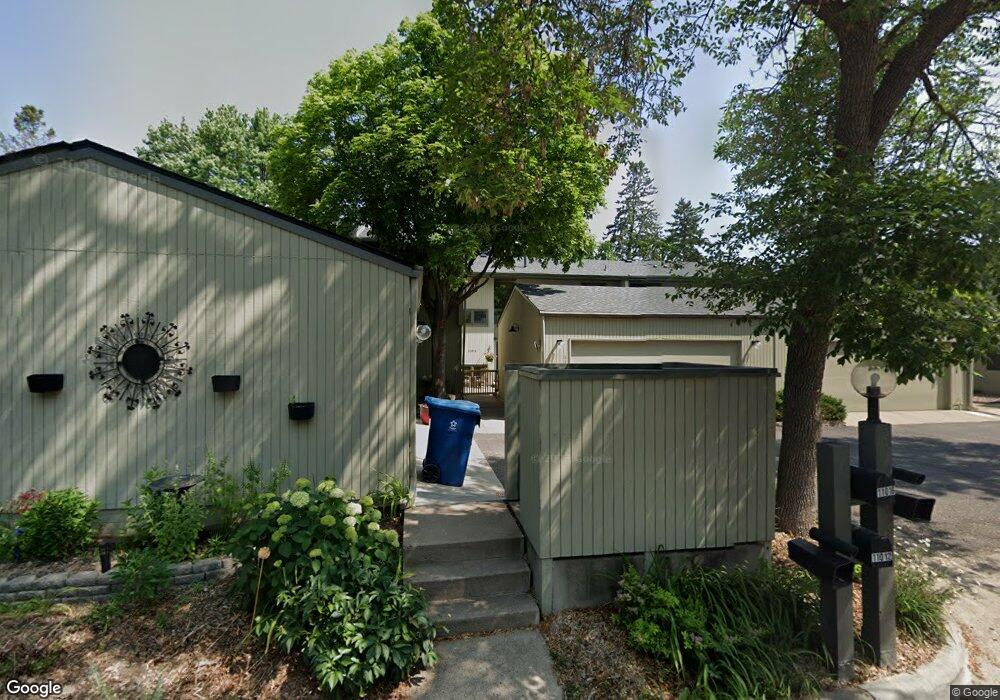
11012 Abbott Ln Hopkins, MN 55343
Estimated Value: $320,000 - $388,000
3
Beds
3
Baths
2,090
Sq Ft
$169/Sq Ft
Est. Value
About This Home
This home is located at 11012 Abbott Ln, Hopkins, MN 55343 and is currently estimated at $352,775, approximately $168 per square foot. 11012 Abbott Ln is a home located in Hennepin County with nearby schools including Gatewood Elementary School, Hopkins West Junior High School, and Hopkins Senior High School.
Ownership History
Date
Name
Owned For
Owner Type
Purchase Details
Closed on
Jul 9, 2021
Sold by
Woodley Carrie
Bought by
Caputo Stephen J and Caputo Alison M
Current Estimated Value
Home Financials for this Owner
Home Financials are based on the most recent Mortgage that was taken out on this home.
Original Mortgage
$160,000
Outstanding Balance
$122,283
Interest Rate
2.9%
Mortgage Type
New Conventional
Estimated Equity
$230,492
Purchase Details
Closed on
Apr 24, 2017
Sold by
Shoop Patricia J and Shoop Robert B
Bought by
Woodley Carrie
Home Financials for this Owner
Home Financials are based on the most recent Mortgage that was taken out on this home.
Original Mortgage
$172,000
Interest Rate
4.14%
Mortgage Type
New Conventional
Purchase Details
Closed on
Jun 10, 1998
Sold by
Olsen Harold D and Olsen Shirley M
Bought by
Shoop Robert B and Shoop Patricia J
Create a Home Valuation Report for This Property
The Home Valuation Report is an in-depth analysis detailing your home's value as well as a comparison with similar homes in the area
Home Values in the Area
Average Home Value in this Area
Purchase History
| Date | Buyer | Sale Price | Title Company |
|---|---|---|---|
| Caputo Stephen J | $360,000 | Trademark Title Services Inc | |
| Woodley Carrie | $215,000 | Burnet Title | |
| Woodley Carrie | $215,000 | Burnet Title | |
| Shoop Robert B | $138,900 | -- | |
| Caputo Alison Alison | $360,000 | -- |
Source: Public Records
Mortgage History
| Date | Status | Borrower | Loan Amount |
|---|---|---|---|
| Open | Caputo Stephen J | $160,000 | |
| Previous Owner | Woodley Carrie | $172,000 | |
| Closed | Caputo Alison Alison | $345,000 |
Source: Public Records
Tax History Compared to Growth
Tax History
| Year | Tax Paid | Tax Assessment Tax Assessment Total Assessment is a certain percentage of the fair market value that is determined by local assessors to be the total taxable value of land and additions on the property. | Land | Improvement |
|---|---|---|---|---|
| 2024 | $3,517 | $303,800 | $54,000 | $249,800 |
| 2023 | $3,585 | $311,700 | $54,000 | $257,700 |
| 2022 | $3,060 | $307,100 | $54,000 | $253,100 |
| 2021 | $3,110 | $256,500 | $50,000 | $206,500 |
| 2020 | $2,974 | $250,900 | $50,000 | $200,900 |
| 2019 | $2,800 | $227,300 | $50,000 | $177,300 |
| 2018 | $2,248 | $215,900 | $50,000 | $165,900 |
| 2017 | $2,284 | $185,100 | $50,000 | $135,100 |
| 2016 | $2,213 | $175,900 | $50,000 | $125,900 |
| 2015 | $2,551 | $194,400 | $40,000 | $154,400 |
| 2014 | -- | $194,400 | $40,000 | $154,400 |
Source: Public Records
Map
Nearby Homes
- 11409 Bren Rd
- 11413 Bren Rd
- 5754 Shady Oak Rd S Unit 1
- 5742 Shady Oak Rd S Unit 7
- 5601 Bimini Dr
- 5524 Bimini Dr
- 5998 Chasewood Pkwy Unit 1
- 6048 Chasewood Pkwy Unit 204
- 6020 Chasewood Pkwy Unit 203
- 5697 Green Circle Dr Unit 219
- 5607 Green Circle Dr Unit 209
- 5607 Green Circle Dr Unit 210
- 1252 Trailwood S
- 1124 Trailwood S
- 801 Smetana Rd Unit 7
- 806 Old Settlers Trail Unit 8
- 702 Old Settlers Trail Unit 3
- 1228 Wagon Wheel Rd
- 920 9th Ave S Unit 5
- 5601 Smetana Dr Unit 313
- 11008 Abbott Ln
- 11016 Abbott Ln
- 11020 Abbott Ln
- 11004 Abbott Ln
- 11000 Abbott Ln
- 11100 Abbott Ln
- 11104 Abbott Ln
- 11108 Abbott Ln
- 11005 Abbott Ln
- 11017 Abbott Ln
- 10940 Abbott Ln
- 10936 Abbott Ln
- 11009 Abbott Ln
- 11013 Abbott Ln
- 10932 Abbott Ln
- 11001 Abbott Ln
- 11112 Abbott Ln
- 11116 Abbott Ln
- 11116 Abbott Ln
- 11120 Abbott Ln