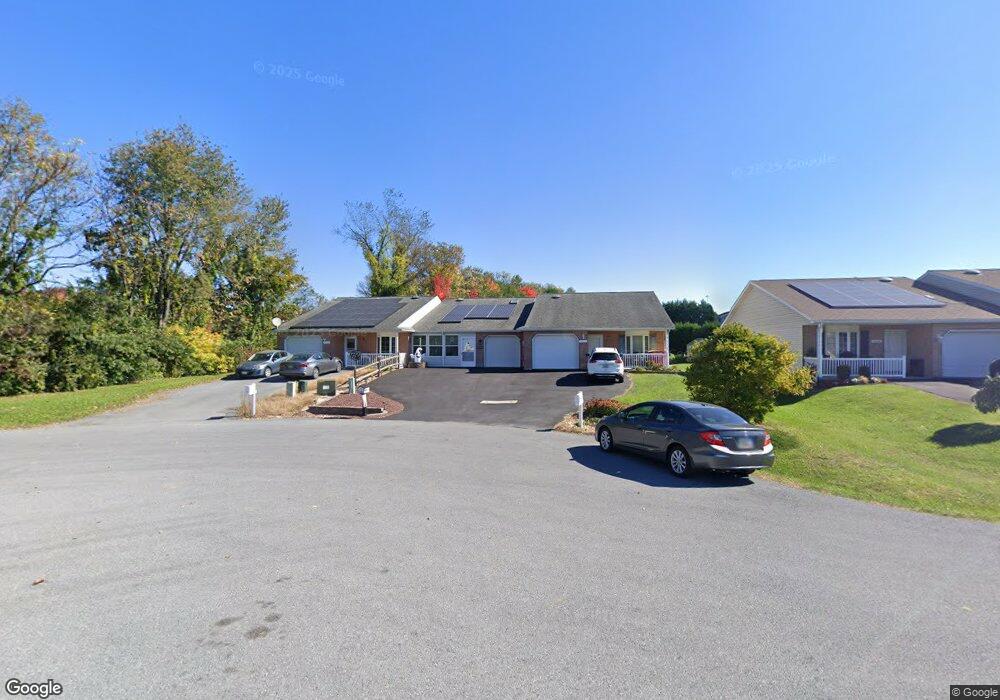
11017 Bragg Ct Williamsport, MD 21795
Estimated Value: $248,289 - $286,000
--
Bed
2
Baths
1,263
Sq Ft
$216/Sq Ft
Est. Value
About This Home
This home is located at 11017 Bragg Ct, Williamsport, MD 21795 and is currently estimated at $273,072, approximately $216 per square foot. 11017 Bragg Ct is a home located in Washington County with nearby schools including Williamsport Elementary School, Springfield Middle School, and Williamsport High School.
Ownership History
Date
Name
Owned For
Owner Type
Purchase Details
Closed on
Dec 7, 2005
Sold by
Catlett Enterprises Inc
Bought by
Pierce James W and Pierce Carol L
Current Estimated Value
Home Financials for this Owner
Home Financials are based on the most recent Mortgage that was taken out on this home.
Original Mortgage
$140,610
Outstanding Balance
$77,593
Interest Rate
6.06%
Mortgage Type
New Conventional
Estimated Equity
$195,479
Purchase Details
Closed on
Nov 10, 2005
Sold by
Catlett Enterprises Inc
Bought by
Pierce James W and Pierce Carol L
Home Financials for this Owner
Home Financials are based on the most recent Mortgage that was taken out on this home.
Original Mortgage
$140,610
Outstanding Balance
$77,593
Interest Rate
6.06%
Mortgage Type
New Conventional
Estimated Equity
$195,479
Purchase Details
Closed on
May 6, 2005
Sold by
Lee Downey Richmond
Bought by
Catlett Enterprises Inc
Create a Home Valuation Report for This Property
The Home Valuation Report is an in-depth analysis detailing your home's value as well as a comparison with similar homes in the area
Home Values in the Area
Average Home Value in this Area
Purchase History
| Date | Buyer | Sale Price | Title Company |
|---|---|---|---|
| Pierce James W | $204,900 | -- | |
| Pierce James W | $204,900 | -- | |
| Catlett Enterprises Inc | $104,000 | -- |
Source: Public Records
Mortgage History
| Date | Status | Borrower | Loan Amount |
|---|---|---|---|
| Open | Pierce James W | $140,610 | |
| Closed | Pierce James W | $140,610 |
Source: Public Records
Tax History Compared to Growth
Tax History
| Year | Tax Paid | Tax Assessment Tax Assessment Total Assessment is a certain percentage of the fair market value that is determined by local assessors to be the total taxable value of land and additions on the property. | Land | Improvement |
|---|---|---|---|---|
| 2025 | $1,838 | $203,900 | $40,000 | $163,900 |
| 2024 | $1,838 | $190,367 | $0 | $0 |
| 2023 | $1,753 | $176,833 | $0 | $0 |
| 2022 | $1,657 | $163,300 | $40,000 | $123,300 |
| 2021 | $1,544 | $161,100 | $0 | $0 |
| 2020 | $1,544 | $158,900 | $0 | $0 |
| 2019 | $1,483 | $156,700 | $40,000 | $116,700 |
| 2018 | $1,406 | $144,167 | $0 | $0 |
| 2017 | $1,332 | $131,633 | $0 | $0 |
| 2016 | -- | $119,100 | $0 | $0 |
| 2015 | $1,835 | $119,100 | $0 | $0 |
| 2014 | $1,835 | $119,100 | $0 | $0 |
Source: Public Records
Map
Nearby Homes
- 11015 Donelson Dr
- 16722 Custer Ct
- 10813 Wilcox Dr
- 10818 Anderson Dr
- 10808 Archer Ln
- 10730 Hershey Dr
- 16804 Longfellow Ct Unit 652
- 16810 Alcott Rd
- 11307 Hawthorne Ct
- 16847 Longfellow Ct
- 10642 Hershey Dr
- 16904 Pickwick Ln Unit 307
- 10701 Bratton Ct
- 16935 Alcott Rd
- 10608 Hershey Dr
- 17125 Miner Ave
- 17218 Tamarack Dr
- 10903 Allen Ave
- 10705 Timothy Dr
- 17325 Diane Dr
- 11015 Bragg Ct
- 11019 Bragg Ct
- 11009 Bragg Ct
- 11007 Bragg Ct
- 11005 Bragg Ct
- 11003 Bragg Ct
- 16834 Cavalry Dr
- 16840 Cavalry Dr
- 11020 Bragg Ct
- 11008 Bragg Ct
- 11014 Bragg Ct
- 11018 Bragg Ct
- 11016 Bragg Ct
- Cavalry Drive Lot 40
- 11004 Bragg Ct
- 16844 Cavalry Dr
- 11002 Bragg Ct
- 16827 Cavalry Dr
- 16831 Cavalry Dr
- 16823 Cavalry Dr