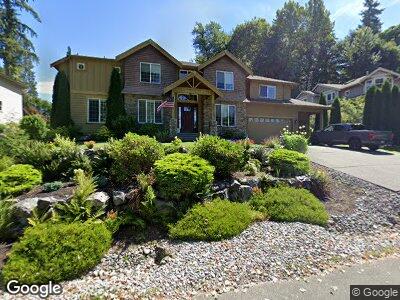
11018 30th St SE Unit Lt 3 Lake Stevens, WA 98258
Bunk Foss NeighborhoodEstimated Value: $1,172,000 - $1,310,000
4
Beds
3
Baths
3,210
Sq Ft
$386/Sq Ft
Est. Value
About This Home
This home is located at 11018 30th St SE Unit Lt 3, Lake Stevens, WA 98258 and is currently estimated at $1,240,416, approximately $386 per square foot. 11018 30th St SE Unit Lt 3 is a home located in Snohomish County with nearby schools including Glenwood Elementary School, Lake Stevens Middle School, and Cavelero Mid High School.
Ownership History
Date
Name
Owned For
Owner Type
Purchase Details
Closed on
Oct 8, 2014
Sold by
Laschober Stephen
Bought by
Taylor Kevin C and Robinson Carmen L
Current Estimated Value
Home Financials for this Owner
Home Financials are based on the most recent Mortgage that was taken out on this home.
Original Mortgage
$54,100
Outstanding Balance
$19,719
Interest Rate
3.24%
Mortgage Type
FHA
Estimated Equity
$1,192,258
Purchase Details
Closed on
Sep 1, 2009
Sold by
Western Ridge Construction Inc
Bought by
Laschober Stephen J
Home Financials for this Owner
Home Financials are based on the most recent Mortgage that was taken out on this home.
Original Mortgage
$70,001
Interest Rate
4.63%
Mortgage Type
New Conventional
Purchase Details
Closed on
Apr 24, 2007
Sold by
Western Meadows Llc
Bought by
Western Ridge Construction Inc
Create a Home Valuation Report for This Property
The Home Valuation Report is an in-depth analysis detailing your home's value as well as a comparison with similar homes in the area
Home Values in the Area
Average Home Value in this Area
Purchase History
| Date | Buyer | Sale Price | Title Company |
|---|---|---|---|
| Taylor Kevin C | $541,000 | First American Title Ins Co | |
| Laschober Stephen J | $472,280 | Chicago Title | |
| Western Ridge Construction Inc | $806,000 | Chicago Title |
Source: Public Records
Mortgage History
| Date | Status | Borrower | Loan Amount |
|---|---|---|---|
| Open | Taylor Kevin C | $54,100 | |
| Open | Taylor Kevin C | $432,800 | |
| Previous Owner | Laschober Stephen J | $70,001 |
Source: Public Records
Tax History Compared to Growth
Tax History
| Year | Tax Paid | Tax Assessment Tax Assessment Total Assessment is a certain percentage of the fair market value that is determined by local assessors to be the total taxable value of land and additions on the property. | Land | Improvement |
|---|---|---|---|---|
| 2025 | $9,232 | $1,163,100 | $473,000 | $690,100 |
| 2024 | $9,232 | $1,021,500 | $417,000 | $604,500 |
| 2023 | $8,908 | $1,071,700 | $447,000 | $624,700 |
| 2022 | $7,993 | $792,800 | $289,000 | $503,800 |
| 2020 | $7,540 | $699,800 | $251,000 | $448,800 |
| 2019 | $7,005 | $641,600 | $217,000 | $424,600 |
| 2018 | $6,923 | $568,300 | $170,000 | $398,300 |
| 2017 | $6,075 | $564,300 | $148,000 | $416,300 |
| 2016 | $6,168 | $532,400 | $133,000 | $399,400 |
| 2015 | $6,017 | $483,400 | $114,000 | $369,400 |
| 2013 | $5,916 | $411,800 | $80,000 | $331,800 |
Source: Public Records
Map
Nearby Homes
- 2324 110th Dr SE
- 3211 103rd Ave SE
- 2306 115th Ave SE Unit B
- 2214 113th Dr SE Unit A
- 3315 101st Dr SE
- 2310 115th Dr SE
- 10305 25th Place SE
- 10240 25th Place SE
- 2210 115th Dr SE
- 12121 21st St SE
- 12125 21st St SE
- 12019 21st St SE
- 12023 21st St SE
- 2712 121st Ave SE
- 2303 118th Ave SE
- 10052 25th Place SE
- 12104 22nd St SE
- 2238 100th Dr SE
- 14809 121st Place NE
- 2121 121st Ave SE