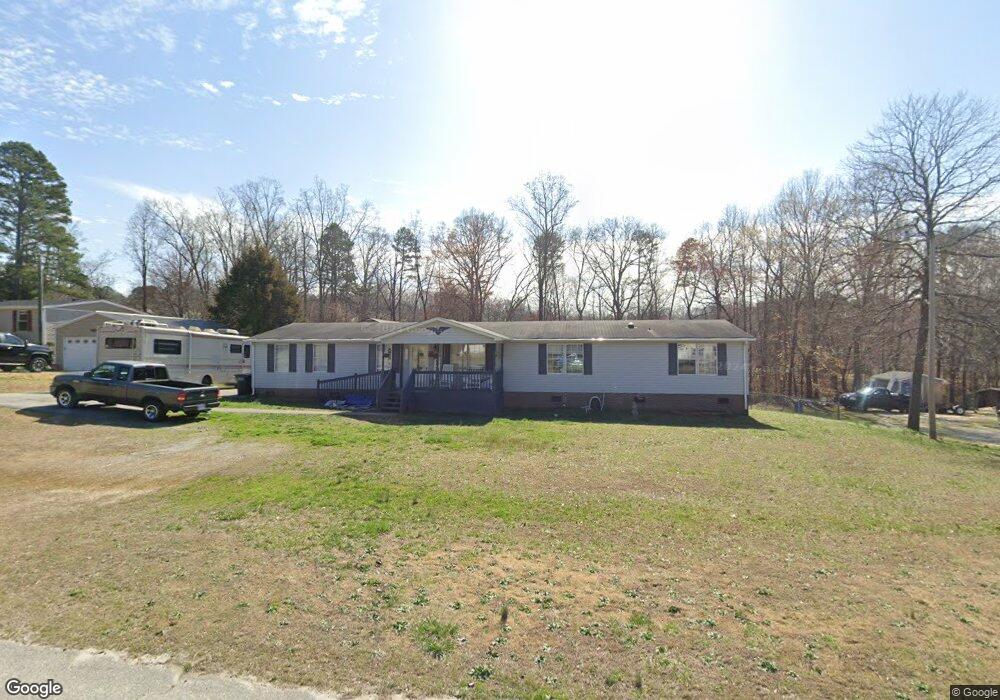
1102 Beagles Run Dr Lincolnton, NC 28092
Estimated Value: $244,000 - $277,000
4
Beds
2
Baths
2,052
Sq Ft
$127/Sq Ft
Est. Value
About This Home
This home is located at 1102 Beagles Run Dr, Lincolnton, NC 28092 and is currently estimated at $260,000, approximately $126 per square foot. 1102 Beagles Run Dr is a home located in Lincoln County with nearby schools including G.E. Massey Elementary School, Lincolnton Middle School, and Lincolnton High School.
Ownership History
Date
Name
Owned For
Owner Type
Purchase Details
Closed on
Mar 20, 2025
Sold by
Fripp Iii Irt Holdings Llc
Bought by
Fripp William E
Current Estimated Value
Purchase Details
Closed on
Nov 14, 2013
Sold by
Federal Home Loan Mortgage Corporation
Bought by
Fripp Iii Irt Holdings Llc
Purchase Details
Closed on
Sep 30, 2013
Sold by
Carpenter Joe B and Carpenter Linda A
Bought by
Federal Home Loan Mortgage Corporation
Purchase Details
Closed on
Sep 25, 2003
Bought by
Carpenter Joe B and Carpenter Linda A
Purchase Details
Closed on
Dec 13, 2000
Bought by
Fleetwood Retail Corp
Purchase Details
Closed on
Aug 16, 1999
Bought by
Piedmont Companies Inc
Create a Home Valuation Report for This Property
The Home Valuation Report is an in-depth analysis detailing your home's value as well as a comparison with similar homes in the area
Home Values in the Area
Average Home Value in this Area
Purchase History
| Date | Buyer | Sale Price | Title Company |
|---|---|---|---|
| Fripp William E | -- | None Listed On Document | |
| Fripp William E | -- | None Listed On Document | |
| Fripp Iii Irt Holdings Llc | -- | None Available | |
| Federal Home Loan Mortgage Corporation | $55,000 | None Available | |
| Carpenter Joe B | $22,000 | -- | |
| Fleetwood Retail Corp | $20,000 | -- | |
| Piedmont Companies Inc | $240,000 | -- |
Source: Public Records
Tax History Compared to Growth
Tax History
| Year | Tax Paid | Tax Assessment Tax Assessment Total Assessment is a certain percentage of the fair market value that is determined by local assessors to be the total taxable value of land and additions on the property. | Land | Improvement |
|---|---|---|---|---|
| 2025 | $1,391 | $200,506 | $33,000 | $167,506 |
| 2024 | $1,371 | $200,506 | $33,000 | $167,506 |
| 2023 | $1,366 | $200,506 | $33,000 | $167,506 |
| 2022 | $935 | $110,208 | $26,000 | $84,208 |
| 2021 | $935 | $110,208 | $26,000 | $84,208 |
| 2020 | $798 | $110,208 | $26,000 | $84,208 |
| 2019 | $776 | $110,208 | $26,000 | $84,208 |
| 2018 | $840 | $103,276 | $23,000 | $80,276 |
| 2017 | $734 | $103,276 | $23,000 | $80,276 |
| 2016 | $734 | $103,276 | $23,000 | $80,276 |
| 2015 | $806 | $103,276 | $23,000 | $80,276 |
| 2014 | $575 | $116,375 | $26,500 | $89,875 |
Source: Public Records
Map
Nearby Homes
- Lot 49 Hares Way
- Lot 51 Hares Way
- Lot 50 Hares Way
- 1235 Wilma Sigmon Rd
- 125 Mallory Tai Dr
- 324 Valerie Dr
- 308 Hubbard St
- 00 Roper Dr
- 00 Walker Branch Rd
- 5544 N Carolina Highway 150
- 401 Little St
- 00 Shell St
- 00 Turner St
- 202 Newbold St
- 1156 Walker Branch Rd
- 00 Eastview Dr
- 127 Villa Ln
- 2815 Highland Dr
- 110 W Pine St
- 112 Julia Dr
- 1114 Beagles Run Dr Unit 25
- 1092 Beagles Run Dr
- 637 Hares Way
- 1115 Beagles Run Dr
- 1128 Beagles Run Dr
- 625 Hares Way
- 649 Hares Way
- 1093 Beagles Run Dr
- 1093 Beagles Run Dr Unit 28
- 1103 Beagles Run Dr
- 615 Hares Way
- 1125 Beagles Run Dr
- 661 Hares Way
- 1073 Beagles Run Dr
- Lot 41 Beagles Run Dr
- Lot 42 Beagles Run Dr
- Lot 42 Beagles Run Rd
- Lot 41 & 42 Beagles Run Dr Unit 41 & 42
- 603 Hares Way
- 675 Hares Way