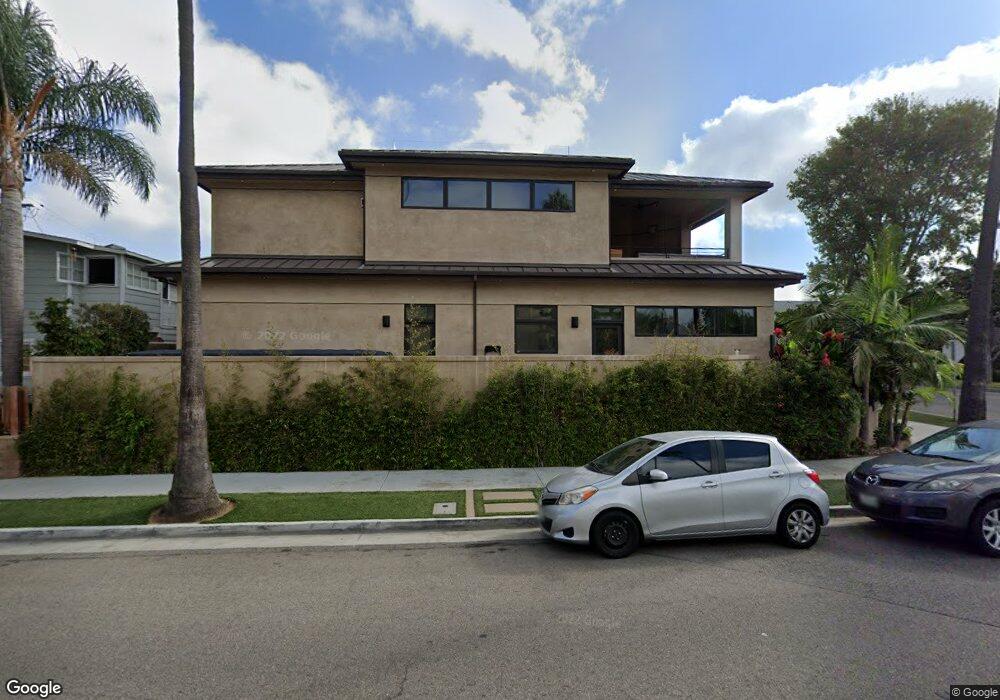
1102 Palm Ave Huntington Beach, CA 92648
Downtown Huntington Beach NeighborhoodEstimated Value: $4,036,491 - $5,165,000
3
Beds
5
Baths
5,063
Sq Ft
$929/Sq Ft
Est. Value
About This Home
This home is located at 1102 Palm Ave, Huntington Beach, CA 92648 and is currently estimated at $4,704,623, approximately $929 per square foot. 1102 Palm Ave is a home located in Orange County with nearby schools including Agnes L. Smith Elementary, Ethel Dwyer Middle, and Huntington Beach High School.
Ownership History
Date
Name
Owned For
Owner Type
Purchase Details
Closed on
Aug 24, 2020
Sold by
Warman Eric Douglas and Warman Nicole Claudine
Bought by
Mcdaniel Elizabeth and Mcdaniel Boyd
Current Estimated Value
Home Financials for this Owner
Home Financials are based on the most recent Mortgage that was taken out on this home.
Original Mortgage
$2,050,000
Outstanding Balance
$1,815,103
Interest Rate
2.9%
Mortgage Type
New Conventional
Estimated Equity
$2,889,520
Purchase Details
Closed on
Jul 2, 2007
Sold by
Warman Eric Douglas and Warman Nicole Claudine
Bought by
Warman Eric Douglas and Warman Nicole Claudine
Purchase Details
Closed on
Jan 9, 1998
Sold by
Miller Paul F
Bought by
Warman Eric Douglas and Warman Nicole Claudine
Home Financials for this Owner
Home Financials are based on the most recent Mortgage that was taken out on this home.
Original Mortgage
$219,600
Interest Rate
7.05%
Create a Home Valuation Report for This Property
The Home Valuation Report is an in-depth analysis detailing your home's value as well as a comparison with similar homes in the area
Home Values in the Area
Average Home Value in this Area
Purchase History
| Date | Buyer | Sale Price | Title Company |
|---|---|---|---|
| Mcdaniel Elizabeth | -- | Ticor Title | |
| Warman Eric Douglas | -- | Accommodation | |
| Warman Eric Douglas | $244,000 | -- |
Source: Public Records
Mortgage History
| Date | Status | Borrower | Loan Amount |
|---|---|---|---|
| Open | Mcdaniel Elizabeth | $2,050,000 | |
| Previous Owner | Warman Eric Douglas | $219,600 |
Source: Public Records
Tax History Compared to Growth
Tax History
| Year | Tax Paid | Tax Assessment Tax Assessment Total Assessment is a certain percentage of the fair market value that is determined by local assessors to be the total taxable value of land and additions on the property. | Land | Improvement |
|---|---|---|---|---|
| 2025 | $36,078 | $3,301,417 | $1,986,360 | $1,315,057 |
| 2024 | $36,078 | $3,236,684 | $1,947,412 | $1,289,272 |
| 2023 | $35,288 | $3,173,220 | $1,909,227 | $1,263,993 |
| 2022 | $34,370 | $3,111,000 | $1,871,791 | $1,239,209 |
| 2021 | $33,727 | $3,050,000 | $1,835,089 | $1,214,911 |
| 2020 | $18,244 | $1,635,437 | $308,357 | $1,327,080 |
| 2019 | $18,021 | $1,603,370 | $302,311 | $1,301,059 |
| 2018 | $17,740 | $1,571,932 | $296,383 | $1,275,549 |
| 2017 | $17,504 | $1,541,110 | $290,571 | $1,250,539 |
| 2016 | $16,711 | $1,510,893 | $284,874 | $1,226,019 |
| 2015 | $16,554 | $1,488,198 | $280,594 | $1,207,604 |
| 2014 | $16,207 | $1,459,047 | $275,098 | $1,183,949 |
Source: Public Records
Map
Nearby Homes
- 526 12th St
- 521 12th St
- 613 13th St
- 621 8th St
- 427 10th St
- 945 10th St
- 949 10th St
- 413 14th St Unit D
- 416 15th St
- 1112 Park St
- 319 14th St Unit B
- 513 Pecan Ave
- 1111 Olive Ave Unit A & B
- 228 12th St Unit 1113 Olive Av
- 204 Lincoln Ave
- 309 8th St
- 221 10th St
- 118 Adams Ave
- 208 Indianapolis Ave
- 505 17th St