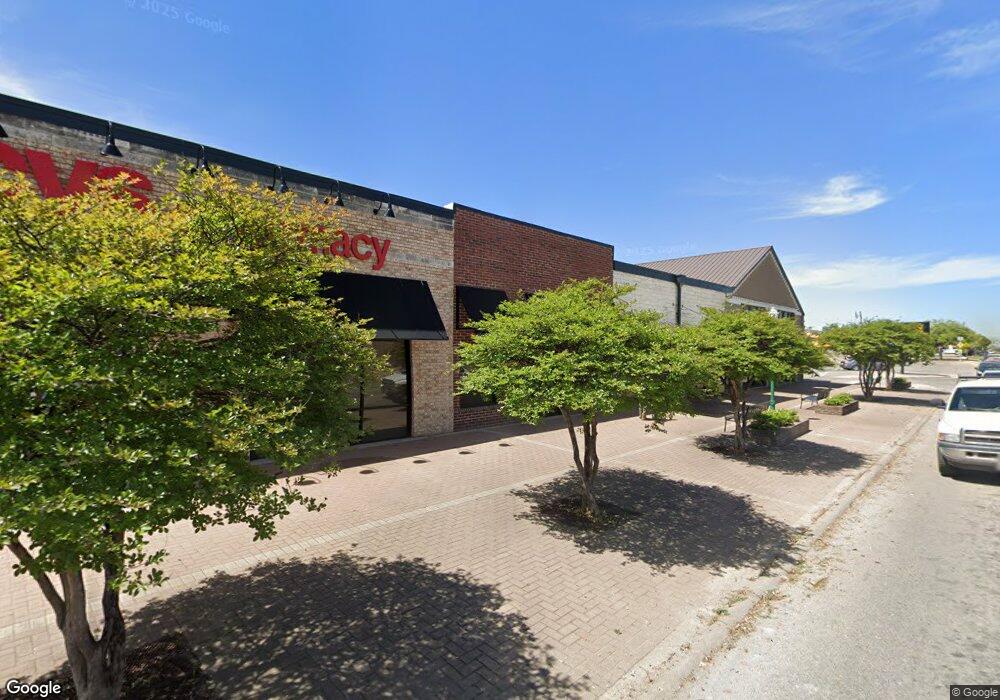
1102 S Austin Ave Georgetown, TX 78626
Estimated Value: $1,197,838
--
Bed
--
Bath
15,771
Sq Ft
$76/Sq Ft
Est. Value
About This Home
This home is located at 1102 S Austin Ave, Georgetown, TX 78626 and is currently priced at $1,197,838, approximately $75 per square foot. 1102 S Austin Ave is a home located in Williamson County with nearby schools including Annie Purl Elementary School, East View High School, and Primrose School of Georgetown.
Ownership History
Date
Name
Owned For
Owner Type
Purchase Details
Closed on
May 17, 2018
Sold by
Bdl Family Ltd
Bought by
Kunz Bruce
Current Estimated Value
Home Financials for this Owner
Home Financials are based on the most recent Mortgage that was taken out on this home.
Original Mortgage
$21,500
Outstanding Balance
$18,601
Interest Rate
4.61%
Purchase Details
Closed on
Jan 29, 2018
Sold by
Dew Holdings Llc
Bought by
Se 2Nd St Trust
Purchase Details
Closed on
Sep 16, 2014
Sold by
Austin At University Lp
Bought by
Pelanje Lp
Home Financials for this Owner
Home Financials are based on the most recent Mortgage that was taken out on this home.
Original Mortgage
$2,013,750
Interest Rate
4.1%
Mortgage Type
Commercial
Create a Home Valuation Report for This Property
The Home Valuation Report is an in-depth analysis detailing your home's value as well as a comparison with similar homes in the area
Home Values in the Area
Average Home Value in this Area
Purchase History
| Date | Buyer | Sale Price | Title Company |
|---|---|---|---|
| Kunz Bruce | -- | -- | |
| Se 2Nd St Trust | -- | None Available | |
| Pelanje Lp | -- | Georgetown Title Company Inc |
Source: Public Records
Mortgage History
| Date | Status | Borrower | Loan Amount |
|---|---|---|---|
| Open | Kunz Bruce | $21,500 | |
| Closed | Kunz Bruce | -- | |
| Previous Owner | Pelanje Lp | $2,013,750 |
Source: Public Records
Tax History Compared to Growth
Tax History
| Year | Tax Paid | Tax Assessment Tax Assessment Total Assessment is a certain percentage of the fair market value that is determined by local assessors to be the total taxable value of land and additions on the property. | Land | Improvement |
|---|---|---|---|---|
| 2025 | $69,773 | $3,956,778 | $1,619,178 | $2,337,600 |
| 2024 | $69,773 | $3,835,593 | $1,619,178 | $2,216,415 |
| 2023 | $62,783 | $3,491,569 | $1,619,178 | $1,872,391 |
| 2022 | $66,229 | $3,373,497 | $1,079,325 | $2,294,172 |
| 2021 | $71,258 | $3,262,988 | $799,500 | $2,463,488 |
| 2020 | $66,500 | $2,998,570 | $759,525 | $2,239,045 |
| 2019 | $45,611 | $1,993,479 | $799,491 | $1,193,988 |
| 2018 | $65,463 | $2,861,108 | $779,479 | $2,081,629 |
| 2017 | $60,637 | $2,625,495 | $745,881 | $1,879,614 |
| 2016 | $63,122 | $2,547,168 | $745,881 | $1,801,287 |
| 2015 | $48,848 | $2,354,962 | $772,760 | $1,582,202 |
| 2014 | $48,848 | $2,106,858 | $0 | $0 |
Source: Public Records
Map
Nearby Homes
- 1103 S Rock St
- 214 W University Ave
- 302 W University Ave
- 1216 Forest St
- 1001 S Church St
- 1250 S Main St
- 1220 S Myrtle St
- 205 E 9th Lot 5b St
- 1001 Railroad St
- 1210 S Myrtle St
- 1507 Hart St
- 207 W 17th St
- 711 W 10th St
- 405 W 17th St
- 1306 S Ash St
- 510 S Church St
- 1704 S Church St
- 1806 S Main St
- 1619 S College St
- 204 E 18th St
- 215 W University Ave Unit 2
- 215 W University Ave
- 1115 S Rock St
- 1201 S Rock St
- 1101 S Rock St
- 211 W 11th St
- 216 W University Ave
- 1112 S Rock St
- 1102 S Rock St
- 1009 S Rock St
- 1104 S Rock St
- 305 W University Ave
- 1208 S Austin Ave
- 1008 S Rock St
- 1005 S Rock St Unit 102
- 1005 S Rock St
- 1000 S Austin Ave
- 206 W 10th St
- 310 W University Ave Unit HOUSE
- 310 W University Ave