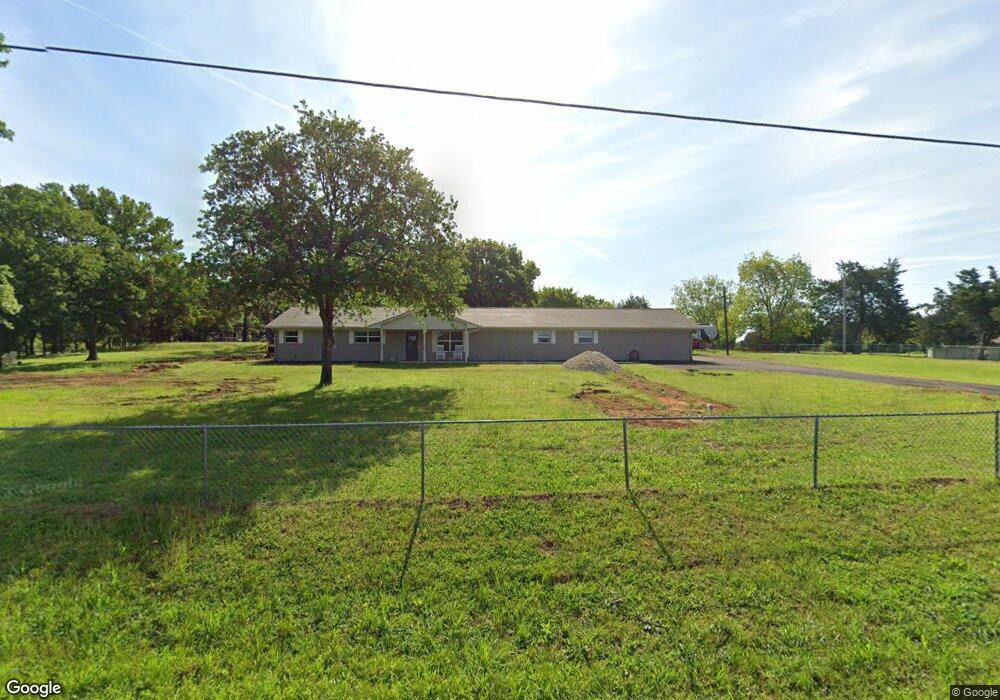
1102 Singletree Rd Denison, TX 75021
Estimated Value: $432,650 - $613,000
3
Beds
3
Baths
3,418
Sq Ft
$153/Sq Ft
Est. Value
About This Home
This home is located at 1102 Singletree Rd, Denison, TX 75021 and is currently estimated at $522,825, approximately $152 per square foot. 1102 Singletree Rd is a home located in Grayson County with nearby schools including Terrell Elementary School, Scott Middle School, and Denison High School.
Ownership History
Date
Name
Owned For
Owner Type
Purchase Details
Closed on
Feb 11, 2019
Sold by
Us Bank Na
Bought by
Brown Christopher C and Brown Catherine D
Current Estimated Value
Home Financials for this Owner
Home Financials are based on the most recent Mortgage that was taken out on this home.
Original Mortgage
$127,575
Outstanding Balance
$111,933
Interest Rate
4.4%
Mortgage Type
New Conventional
Estimated Equity
$410,892
Purchase Details
Closed on
Jul 12, 2018
Sold by
Fehr Richard Craig and Fehr Vanessa Dawn
Bought by
U S Bank National Association
Purchase Details
Closed on
Jan 25, 2005
Sold by
Allen James W and Allen Jean Ann
Bought by
Fehr Richard Craig and Fehr Vanessa Dawn
Home Financials for this Owner
Home Financials are based on the most recent Mortgage that was taken out on this home.
Original Mortgage
$101,000
Interest Rate
8.5%
Mortgage Type
Purchase Money Mortgage
Create a Home Valuation Report for This Property
The Home Valuation Report is an in-depth analysis detailing your home's value as well as a comparison with similar homes in the area
Home Values in the Area
Average Home Value in this Area
Purchase History
We collect this data history from publicly available records. To have your information removed, we recommend requesting removal directly through your county’s website.
| Date | Buyer | Sale Price | Title Company |
|---|---|---|---|
| Brown Christopher C | -- | First American Mortgage Solu | |
| U S Bank National Association | $167,398 | Avt Title Services Llc | |
| Fehr Richard Craig | -- | -- |
Source: Public Records
Mortgage History
We collect this data history from publicly available records. To have your information removed, we recommend requesting removal directly through your county’s website.
| Date | Status | Borrower | Loan Amount |
|---|---|---|---|
| Open | Brown Christopher C | $127,575 | |
| Previous Owner | Fehr Richard Craig | $101,000 |
Source: Public Records
Tax History
| Year | Tax Paid | Tax Assessment Tax Assessment Total Assessment is a certain percentage of the fair market value that is determined by local assessors to be the total taxable value of land and additions on the property. | Land | Improvement |
|---|---|---|---|---|
| 2025 | $5,045 | $440,944 | -- | -- |
| 2024 | $6,474 | $400,858 | $0 | $0 |
| 2023 | $4,404 | $364,416 | $0 | $0 |
| 2022 | $5,724 | $331,287 | $0 | $0 |
| 2021 | $5,646 | $301,170 | $67,446 | $233,724 |
| 2020 | $4,540 | $228,061 | $45,478 | $182,583 |
| 2019 | $5,072 | $238,844 | $42,986 | $195,858 |
| 2018 | $5,146 | $239,714 | $34,935 | $204,779 |
| 2017 | $4,786 | $241,914 | $38,257 | $203,657 |
| 2016 | $4,351 | $226,370 | $26,917 | $199,453 |
| 2015 | $3,433 | $183,087 | $24,444 | $158,643 |
| 2014 | $3,341 | $202,434 | $24,444 | $177,990 |
Source: Public Records
Map
Nearby Homes
- TBD Singletree Rd
- TBD E Fm 120
- TBD-2 Singletree Rd
- 268 Coe Rd
- TBD Ledbetter Ln
- 3467 E Fm 120
- 2550 E 120
- 4019 E Fm 120
- 566 Mccraw Ln
- 387 Immigrant Trail Rd
- 193 Gun Club Rd
- 4822 Fm 1753
- 1549 Starr Rd
- 1808 E Fm 120
- 492 Richerson Rd
- 40 Cumberland Cir
- 426 Gun Club Rd
- 4489 E Farm To Market 120
- 1655 E Fm 120
- 4489 E Fm 120
- 1050 Singletree Rd
- 25 Starling Dr
- 1226 Singletree Rd
- 1227 Singletree Rd
- 990 Singletree Rd
- 83 Starling Dr
- 969 Singletree Rd
- 1347 Singletree Rd
- 908 Singletree Rd
- 1073 Singletree Rd
- 1129 Singletree Rd
- TBD Tanager Springs Dr
- TBD Tananger Springs Dr
- tbd1 Ansley
- Arthur Arthur Rd
- TBD Us Hwy 75
- 42 AC Fm 120
- 15 Ac Dripping Springs Rd
- TBD Arthur Rd
- 10 Ac Middle Rd
Your Personal Tour Guide
Ask me questions while you tour the home.