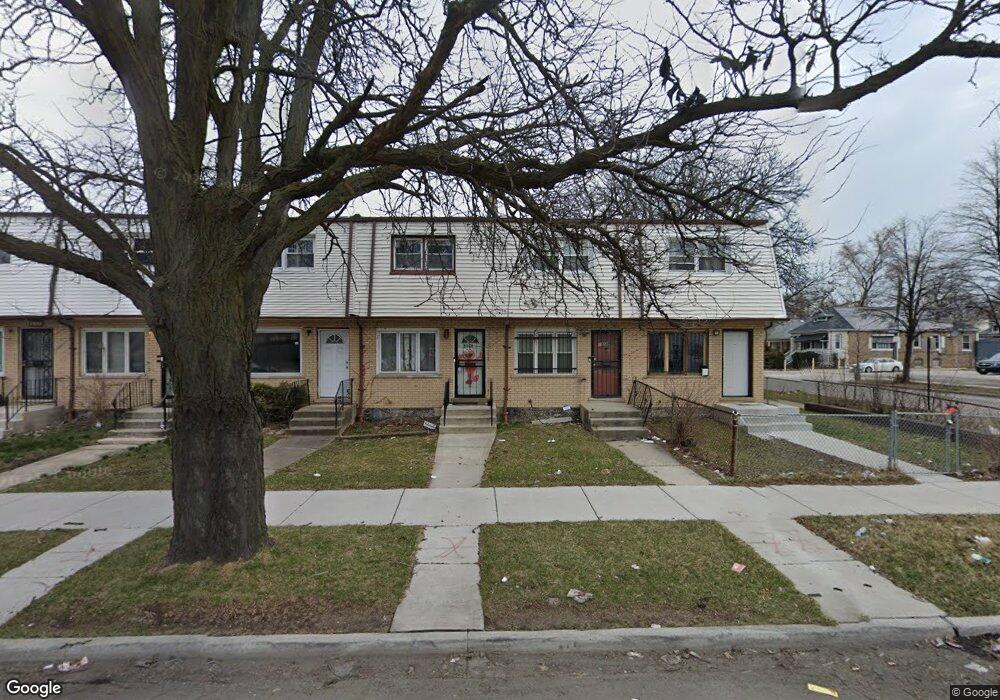
1102 W 87th St Unit 1 Chicago, IL 60620
Auburn Gresham NeighborhoodEstimated Value: $103,000 - $116,000
2
Beds
2
Baths
1,026
Sq Ft
$106/Sq Ft
Est. Value
About This Home
This home is located at 1102 W 87th St Unit 1, Chicago, IL 60620 and is currently estimated at $108,682, approximately $105 per square foot. 1102 W 87th St Unit 1 is a home located in Cook County with nearby schools including Gresham School of Excellence, Emil G. Hirsch Metropolitan High School, and Hansberry College Prep.
Ownership History
Date
Name
Owned For
Owner Type
Purchase Details
Closed on
Apr 2, 2022
Sold by
Nobles Lawrence W and Nobles-Little Chevon D
Bought by
Bryan Precious
Current Estimated Value
Home Financials for this Owner
Home Financials are based on the most recent Mortgage that was taken out on this home.
Original Mortgage
$65,250
Outstanding Balance
$52,602
Interest Rate
4.25%
Mortgage Type
New Conventional
Estimated Equity
$56,080
Purchase Details
Closed on
Jul 31, 2007
Sold by
Bridgeview Bank Group
Bought by
Nobles Lawrence W and Nobles Lawrence W
Home Financials for this Owner
Home Financials are based on the most recent Mortgage that was taken out on this home.
Original Mortgage
$12,363
Interest Rate
6.69%
Mortgage Type
Stand Alone Second
Purchase Details
Closed on
May 7, 2007
Sold by
Williams
Bought by
Bridgeview Bank & Trust and Trust #1-3037
Purchase Details
Closed on
May 25, 2006
Sold by
Williams Joyce A
Bought by
Johnson Sandra M
Create a Home Valuation Report for This Property
The Home Valuation Report is an in-depth analysis detailing your home's value as well as a comparison with similar homes in the area
Home Values in the Area
Average Home Value in this Area
Purchase History
| Date | Buyer | Sale Price | Title Company |
|---|---|---|---|
| Bryan Precious | $87,000 | Stewart Title Company | |
| Bryan Precious | $87,000 | -- | |
| Nobles Lawrence W | $62,000 | Enterprise Title Svcs Inc | |
| Bridgeview Bank & Trust | $45,500 | None Available | |
| Johnson Sandra M | $28,000 | None Available |
Source: Public Records
Mortgage History
| Date | Status | Borrower | Loan Amount |
|---|---|---|---|
| Open | Bryan Precious | $65,250 | |
| Closed | Bryan Precious | $65,250 | |
| Closed | Nobles Lawrence W | $12,363 | |
| Closed | Nobles Lawrence W | $49,449 |
Source: Public Records
Tax History
| Year | Tax Paid | Tax Assessment Tax Assessment Total Assessment is a certain percentage of the fair market value that is determined by local assessors to be the total taxable value of land and additions on the property. | Land | Improvement |
|---|---|---|---|---|
| 2025 | $1,266 | $6,401 | $862 | $5,539 |
| 2024 | $1,266 | $6,401 | $862 | $5,539 |
| 2023 | $1,234 | $6,000 | $1,292 | $4,708 |
| 2022 | $1,234 | $6,000 | $1,292 | $4,708 |
| 2021 | $1,206 | $5,999 | $1,292 | $4,707 |
| 2020 | $2,242 | $10,065 | $1,292 | $8,773 |
| 2019 | $2,222 | $11,061 | $1,292 | $9,769 |
| 2018 | $2,185 | $11,061 | $1,292 | $9,769 |
| 2017 | $2,055 | $9,544 | $1,119 | $8,425 |
| 2016 | $1,912 | $9,544 | $1,119 | $8,425 |
| 2015 | $1,749 | $9,544 | $1,119 | $8,425 |
| 2014 | $1,446 | $7,795 | $1,033 | $6,762 |
| 2013 | $1,418 | $7,795 | $1,033 | $6,762 |
Source: Public Records
Map
Nearby Homes
- 8714 S May St
- 8634 S Carpenter St
- 8611 S Aberdeen St
- 1146 W 88th St
- 8618 S Morgan St
- 8643 S Morgan St
- 8802 S Carpenter St
- 8607 S Morgan St
- 8810 S Racine Ave
- 8521 S Carpenter St
- 8731 S Throop St
- 440 W 87th St
- 8745 S Throop St
- 8817 S Elizabeth St
- 8845 S Carpenter St
- 8441 S Aberdeen St
- 8837 S Throop St
- 850 W 86th Place
- 8513 S Sangamon St
- 8438 S Morgan St
- 1102 W 87th St Unit A
- 1102 W 87th St
- 1102 W 87th St
- 1104 W 87th St Unit 1
- 1104 W 87th St
- 1104B W 87th St
- 1106 W 87th St
- 1106 W 87th St Unit A
- 1108 W 87th St Unit A
- 1108 W 87th St
- 1108 W 87th St
- 1108 W 87th St Unit B
- 8642 S Aberdeen St
- 1056 W 87th St
- 8638 S Aberdeen St
- 1114 W 87th St
- 1114 W 87th St
- 1114 W 87th St Unit B
- 1114 W 87th St Unit A
- 1116 W 87th St
Your Personal Tour Guide
Ask me questions while you tour the home.