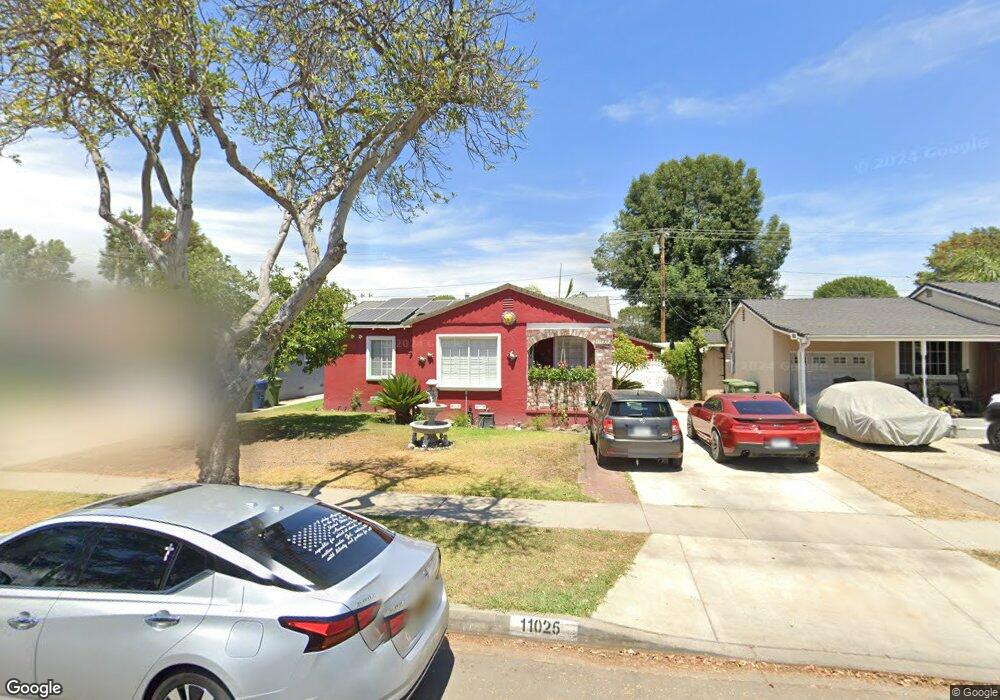
11025 Coolhurst Dr Whittier, CA 90606
West Whittier-Los Nietos NeighborhoodEstimated Value: $698,664 - $768,000
2
Beds
1
Bath
996
Sq Ft
$738/Sq Ft
Est. Value
About This Home
This home is located at 11025 Coolhurst Dr, Whittier, CA 90606 and is currently estimated at $735,166, approximately $738 per square foot. 11025 Coolhurst Dr is a home located in Los Angeles County with nearby schools including Daniel Phelan Language Academy, Katherine Edwards Middle School, and Pioneer High School.
Ownership History
Date
Name
Owned For
Owner Type
Purchase Details
Closed on
Nov 5, 2020
Sold by
Ramirez Magdiel and Encinas Cristina Ramirez
Bought by
Ramirez Magdiel and Encinas Cristina Ramirez
Current Estimated Value
Home Financials for this Owner
Home Financials are based on the most recent Mortgage that was taken out on this home.
Original Mortgage
$182,000
Interest Rate
2.3%
Mortgage Type
New Conventional
Purchase Details
Closed on
Nov 3, 2005
Sold by
Flores Magdaleno and Sepulveda Cristina
Bought by
Sepulveda Cristina
Home Financials for this Owner
Home Financials are based on the most recent Mortgage that was taken out on this home.
Original Mortgage
$183,000
Interest Rate
5.9%
Mortgage Type
New Conventional
Purchase Details
Closed on
Mar 18, 1994
Sold by
Olson Jack and Olson Patricia
Bought by
Flores Magdaleno
Home Financials for this Owner
Home Financials are based on the most recent Mortgage that was taken out on this home.
Original Mortgage
$145,800
Interest Rate
7.15%
Create a Home Valuation Report for This Property
The Home Valuation Report is an in-depth analysis detailing your home's value as well as a comparison with similar homes in the area
Home Values in the Area
Average Home Value in this Area
Purchase History
| Date | Buyer | Sale Price | Title Company |
|---|---|---|---|
| Ramirez Magdiel | -- | Placer Title Company | |
| Sepulveda Cristina | -- | United Title Company-La | |
| Flores Magdaleno | $162,000 | -- |
Source: Public Records
Mortgage History
| Date | Status | Borrower | Loan Amount |
|---|---|---|---|
| Previous Owner | Ramirez Magdiel | $182,000 | |
| Previous Owner | Sepulveda Cristina | $183,000 | |
| Previous Owner | Flores Magdaleno | $145,800 |
Source: Public Records
Tax History
| Year | Tax Paid | Tax Assessment Tax Assessment Total Assessment is a certain percentage of the fair market value that is determined by local assessors to be the total taxable value of land and additions on the property. | Land | Improvement |
|---|---|---|---|---|
| 2025 | $4,218 | $332,493 | $215,286 | $117,207 |
| 2024 | $4,218 | $325,974 | $211,065 | $114,909 |
| 2023 | $4,141 | $319,583 | $206,927 | $112,656 |
| 2022 | $4,057 | $313,318 | $202,870 | $110,448 |
| 2021 | $3,974 | $307,176 | $198,893 | $108,283 |
| 2020 | $7,611 | $304,027 | $196,854 | $107,173 |
| 2019 | $7,574 | $298,067 | $192,995 | $105,072 |
| 2018 | $3,745 | $292,223 | $189,211 | $103,012 |
| 2016 | $3,594 | $280,877 | $181,864 | $99,013 |
| 2015 | $3,519 | $276,659 | $179,133 | $97,526 |
| 2014 | $3,469 | $271,241 | $175,625 | $95,616 |
Source: Public Records
Map
Nearby Homes
- 7406 Norwalk Blvd
- 10704 Balfour St
- 10934 Choisser St
- 10550 Dunlap Crossing Rd
- 10550 Dunlap Crossing Rd Unit 27
- 11454 Aldrich St
- 10512 Rose Hedge Dr
- 7808 Pioneer Blvd
- 6805 Pioneer Blvd
- 10853 Glencannon Dr
- 7209 Lynalan Ave
- 7429 Kengard Ave
- 11783 E Melody Way
- 7409 Kengard Ave
- 8348 Norwalk Blvd
- 11643 Aeolian St
- 11825 Washington Blvd Unit 51
- 9603 Homebrook St
- 10608 Whittier Blvd
- 11141 Dorland St
- 11019 Coolhurst Dr
- 11031 Coolhurst Dr
- 11013 Coolhurst Dr
- 11035 Coolhurst Dr
- 7425 Vicki Dr
- 11024 Coolhurst Dr
- 11009 Coolhurst Dr
- 11018 Coolhurst Dr
- 11030 Coolhurst Dr
- 11014 Coolhurst Dr
- 11036 Coolhurst Dr
- 11003 Coolhurst Dr
- 11040 Coolhurst Dr
- 11002 Coolhurst Dr
- 10941 Coolhurst Dr
- 11025 Balfour St
- 11019 Balfour St
- 11031 Balfour St
- 11015 Balfour St
- 11037 Balfour St
Your Personal Tour Guide
Ask me questions while you tour the home.