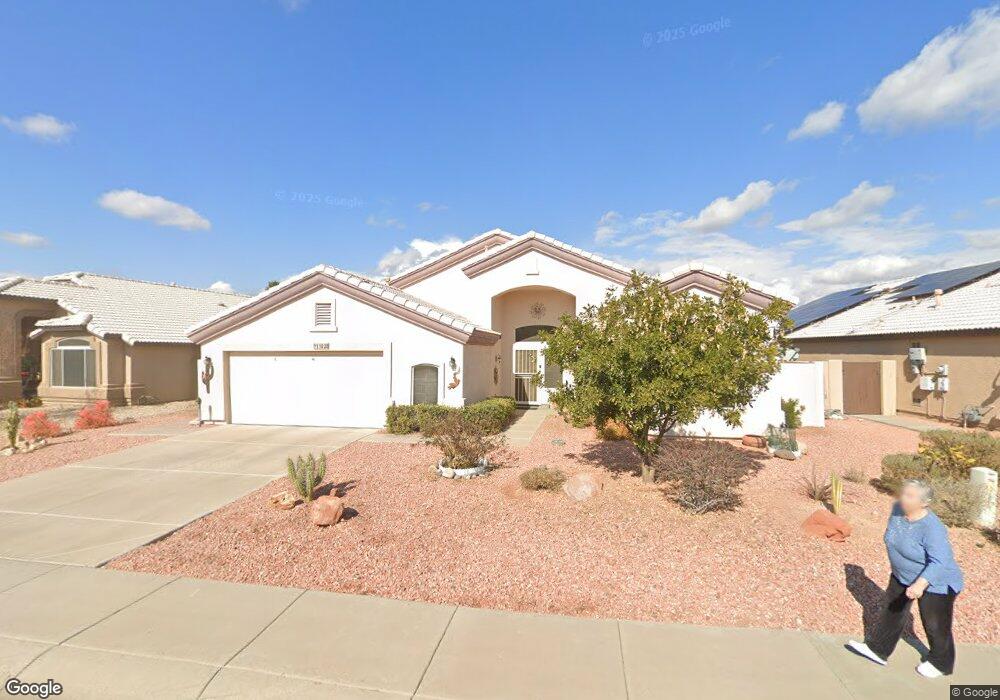
11028 W Chino Dr Sun City, AZ 85373
Estimated Value: $426,000 - $514,000
2
Beds
2
Baths
1,963
Sq Ft
$237/Sq Ft
Est. Value
About This Home
This home is located at 11028 W Chino Dr, Sun City, AZ 85373 and is currently estimated at $464,932, approximately $236 per square foot. 11028 W Chino Dr is a home located in Maricopa County with nearby schools including Parkridge Elementary School, Sunrise Mountain High School, and Guidepost Montessori at Peoria.
Ownership History
Date
Name
Owned For
Owner Type
Purchase Details
Closed on
Feb 28, 2011
Sold by
Gale Janice Grace
Bought by
Gale Janice Grace and Janice Grace Gale Trust
Current Estimated Value
Purchase Details
Closed on
Oct 7, 2010
Sold by
Milam Bonnie M and Calderwood Julie Ann
Bought by
Gale Janice G
Purchase Details
Closed on
Jun 4, 2001
Sold by
Calderwood David L
Bought by
Calderwood Julie Ann
Purchase Details
Closed on
May 30, 2001
Sold by
Shea Homes Inc
Bought by
Milam Bonnie M
Purchase Details
Closed on
May 16, 2001
Sold by
Milan Bonnie M
Bought by
Milan Bonnie M and Calderwood Julie Ann
Purchase Details
Closed on
Mar 19, 2001
Sold by
Milam Willie N
Bought by
Milam Bonnie M
Purchase Details
Closed on
Dec 4, 2000
Sold by
Shea Homes Inc
Bought by
Udc Homes Construction Inc
Purchase Details
Closed on
Oct 27, 2000
Sold by
Lennar Homes Of Arizona Inc
Bought by
Lennar Communities Development Inc
Create a Home Valuation Report for This Property
The Home Valuation Report is an in-depth analysis detailing your home's value as well as a comparison with similar homes in the area
Home Values in the Area
Average Home Value in this Area
Purchase History
| Date | Buyer | Sale Price | Title Company |
|---|---|---|---|
| Gale Janice Grace | -- | Accommodation | |
| Gale Janice G | $230,000 | Equity Title Agency Inc | |
| Calderwood Julie Ann | -- | First American Title | |
| Milam Bonnie M | $197,082 | First American Title | |
| Shea Homes Inc | -- | First American Title | |
| Milan Bonnie M | -- | First American Title | |
| Milam Bonnie M | -- | First American Title | |
| Udc Homes Construction Inc | -- | -- | |
| Lennar Communities Development Inc | -- | North American Title Agency |
Source: Public Records
Tax History Compared to Growth
Tax History
| Year | Tax Paid | Tax Assessment Tax Assessment Total Assessment is a certain percentage of the fair market value that is determined by local assessors to be the total taxable value of land and additions on the property. | Land | Improvement |
|---|---|---|---|---|
| 2025 | $2,495 | $28,768 | -- | -- |
| 2024 | $2,420 | $27,398 | -- | -- |
| 2023 | $2,420 | $36,920 | $7,380 | $29,540 |
| 2022 | $2,365 | $29,400 | $5,880 | $23,520 |
| 2021 | $2,511 | $28,710 | $5,740 | $22,970 |
| 2020 | $2,541 | $25,670 | $5,130 | $20,540 |
| 2019 | $2,472 | $24,710 | $4,940 | $19,770 |
| 2018 | $2,317 | $23,960 | $4,790 | $19,170 |
| 2017 | $2,328 | $21,780 | $4,350 | $17,430 |
| 2016 | $2,294 | $21,580 | $4,310 | $17,270 |
| 2015 | $2,147 | $20,600 | $4,120 | $16,480 |
Source: Public Records
Map
Nearby Homes
- 11023 W Chino Dr
- 11021 W Tonto Ln
- 20037 N 110th Ln
- 19927 N 108th Ln
- 11029 W Oraibi Dr
- 10914 W Cimarron Dr
- 10956 W Cimarron Dr
- 19822 N 108th Ave
- 11002 W Yukon Dr
- 20056 N 107th Ln
- 20323 N 110th Ln
- 19616 N 107th Dr
- 19535 N 107th Dr Unit 2
- 10952 W Tonopah Dr
- 11076 W Runion Dr
- 19222 N Pierson Rd
- 10625 W Chisholm Ct
- 19822 N Turquoise Hills Dr
- 10763 W Runion Dr
- 0 W Beardsley Rd Unit 6772614
- 11032 W Chino Dr
- 11024 W Chino Dr
- 11036 W Chino Dr
- 11020 W Chino Dr
- 11027 W Chino Dr
- 11031 W Chino Dr
- 11016 W Chino Dr
- 11040 W Chino Dr
- 11019 W Chino Dr
- 11039 W Chino Dr
- 11009 W Escuda Dr
- 11017 W Escuda Dr
- 11001 W Escuda Dr
- 11015 W Chino Dr
- 11025 W Escuda Dr
- 10914 W Chino Dr
- 10931 W Escuda Dr
- 11043 W Chino Dr
- 11033 W Escuda Dr
- 11041 W Escuda Dr