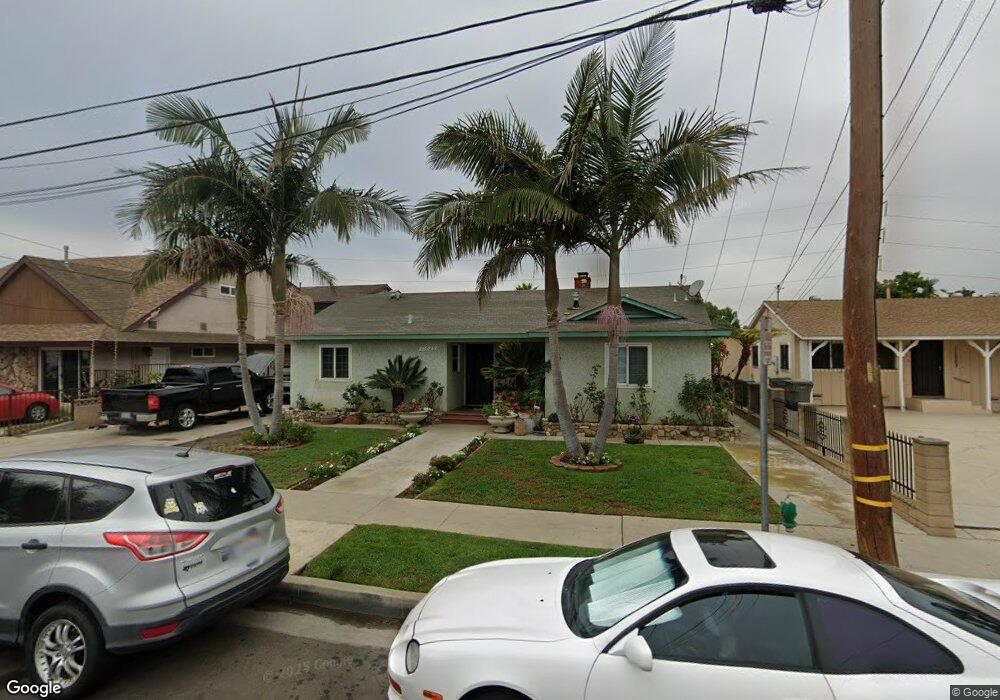
11029 S Truro Ave Inglewood, CA 90304
Lennox NeighborhoodEstimated Value: $790,000 - $945,326
3
Beds
2
Baths
1,315
Sq Ft
$657/Sq Ft
Est. Value
About This Home
This home is located at 11029 S Truro Ave, Inglewood, CA 90304 and is currently estimated at $864,332, approximately $657 per square foot. 11029 S Truro Ave is a home located in Los Angeles County with nearby schools including Buford Elementary School, Lennox Middle School, and Hawthorne High School.
Ownership History
Date
Name
Owned For
Owner Type
Purchase Details
Closed on
Jun 28, 2007
Sold by
Ruiz Ramon
Bought by
Ruiz Ramon and Ruiz Hilda
Current Estimated Value
Home Financials for this Owner
Home Financials are based on the most recent Mortgage that was taken out on this home.
Original Mortgage
$200,000
Outstanding Balance
$122,511
Interest Rate
6.21%
Mortgage Type
New Conventional
Estimated Equity
$741,821
Purchase Details
Closed on
Jun 22, 2007
Sold by
Ruiz Hilda
Bought by
Ruiz Ramon
Home Financials for this Owner
Home Financials are based on the most recent Mortgage that was taken out on this home.
Original Mortgage
$200,000
Outstanding Balance
$122,511
Interest Rate
6.21%
Mortgage Type
New Conventional
Estimated Equity
$741,821
Purchase Details
Closed on
Sep 22, 1994
Sold by
Keolian Krikor
Bought by
Ruiz Ramon and Ruiz Hilda
Home Financials for this Owner
Home Financials are based on the most recent Mortgage that was taken out on this home.
Original Mortgage
$126,000
Interest Rate
8.87%
Create a Home Valuation Report for This Property
The Home Valuation Report is an in-depth analysis detailing your home's value as well as a comparison with similar homes in the area
Home Values in the Area
Average Home Value in this Area
Purchase History
| Date | Buyer | Sale Price | Title Company |
|---|---|---|---|
| Ruiz Ramon | -- | None Available | |
| Ruiz Ramon | -- | Investors Title Company | |
| Ruiz Ramon | $140,000 | Fidelity National Title Ins |
Source: Public Records
Mortgage History
| Date | Status | Borrower | Loan Amount |
|---|---|---|---|
| Open | Ruiz Ramon | $200,000 | |
| Previous Owner | Ruiz Ramon | $126,000 |
Source: Public Records
Tax History Compared to Growth
Tax History
| Year | Tax Paid | Tax Assessment Tax Assessment Total Assessment is a certain percentage of the fair market value that is determined by local assessors to be the total taxable value of land and additions on the property. | Land | Improvement |
|---|---|---|---|---|
| 2025 | $5,170 | $235,127 | $173,162 | $61,965 |
| 2024 | $5,170 | $230,517 | $169,767 | $60,750 |
| 2023 | $4,905 | $225,998 | $166,439 | $59,559 |
| 2022 | $4,820 | $221,568 | $163,176 | $58,392 |
| 2021 | $4,633 | $217,225 | $159,977 | $57,248 |
| 2020 | $4,446 | $214,998 | $158,337 | $56,661 |
| 2019 | $4,188 | $210,783 | $155,233 | $55,550 |
| 2018 | $4,032 | $206,651 | $152,190 | $54,461 |
| 2016 | $3,698 | $198,629 | $146,281 | $52,348 |
| 2015 | $3,612 | $195,646 | $144,084 | $51,562 |
| 2014 | $3,602 | $191,814 | $141,262 | $50,552 |
Source: Public Records
Map
Nearby Homes
- 10905 Dalerose Ave
- 11031 S Burin Ave
- 4505 Lennox Blvd
- 10910 S Burl Ave
- 4900 Lennox Blvd
- 4341 W 106th St
- 11521 Inglewood Ave
- 4322 W 106th St
- 11319 Larch Ave
- 10333 S Inglewood Ave
- 11620 Inglewood Ave
- 4323 W 105th St
- 4703 W 118th St
- 11537 Birch Ave
- 4136 W 111th St
- 11830 Manor Dr Unit A
- 11835 Gale Ave
- 4115 W 111th St
- 4845 W 118th Place Unit 2
- 11894 Truro Ave
- 11035 S Truro Ave
- 11023 S Truro Ave
- 11015 S Truro Ave
- 11024 Condon Ave
- 11028 Condon Ave
- 11034 Condon Ave
- 4641 W 111th St
- 11039 S Truro Ave
- 4643 W 111th St
- 11040 Condon Ave
- 11011 S Truro Ave
- 11030 S Truro Ave
- 11014 Condon Ave
- 11024 S Truro Ave
- 11032 S Truro Ave
- 11018 S Truro Ave
- 11044 Condon Ave
- 4623 W 111th St
- 11007 S Truro Ave
- 11010 Condon Ave