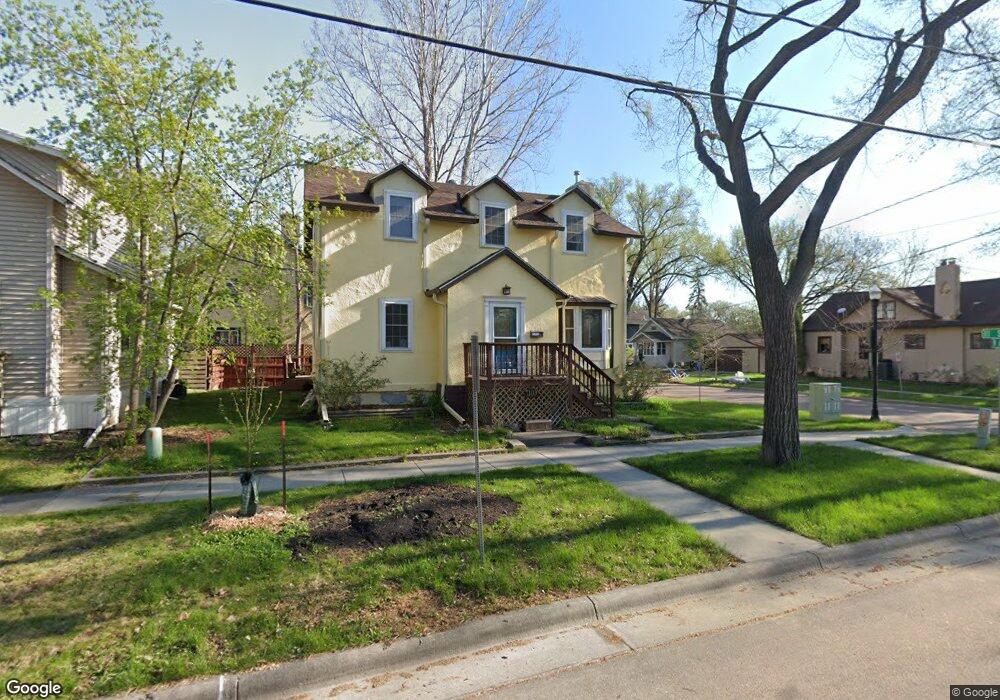
1103 9th Ave S Fargo, ND 58103
Hawthorne NeighborhoodEstimated Value: $220,000 - $240,000
4
Beds
2
Baths
1,536
Sq Ft
$149/Sq Ft
Est. Value
About This Home
This home is located at 1103 9th Ave S, Fargo, ND 58103 and is currently estimated at $228,204, approximately $148 per square foot. 1103 9th Ave S is a home located in Cass County with nearby schools including Clara Barton Elementary School, Ben Franklin Middle School, and South High School.
Ownership History
Date
Name
Owned For
Owner Type
Purchase Details
Closed on
May 12, 2014
Sold by
Buchanan Kylee A and Buchanan Christopher
Bought by
Hopper Matthew and Hopper Jescia
Current Estimated Value
Home Financials for this Owner
Home Financials are based on the most recent Mortgage that was taken out on this home.
Original Mortgage
$148,700
Outstanding Balance
$113,337
Interest Rate
4.41%
Mortgage Type
New Conventional
Estimated Equity
$114,867
Purchase Details
Closed on
Dec 22, 2008
Sold by
Frider Jeffrey P and Frider Debra K
Bought by
Smith Kylee A
Purchase Details
Closed on
Oct 7, 2008
Sold by
Gate City Bank
Bought by
Frider Jeffrey P
Purchase Details
Closed on
Apr 2, 2008
Sold by
Dakken Barbara A
Bought by
Gate City Bank
Create a Home Valuation Report for This Property
The Home Valuation Report is an in-depth analysis detailing your home's value as well as a comparison with similar homes in the area
Home Values in the Area
Average Home Value in this Area
Purchase History
| Date | Buyer | Sale Price | Title Company |
|---|---|---|---|
| Hopper Matthew | $153,300 | Us Title | |
| Smith Kylee A | -- | -- | |
| Frider Jeffrey P | -- | -- | |
| Gate City Bank | -- | -- |
Source: Public Records
Mortgage History
| Date | Status | Borrower | Loan Amount |
|---|---|---|---|
| Open | Hopper Matthew | $148,700 |
Source: Public Records
Tax History Compared to Growth
Tax History
| Year | Tax Paid | Tax Assessment Tax Assessment Total Assessment is a certain percentage of the fair market value that is determined by local assessors to be the total taxable value of land and additions on the property. | Land | Improvement |
|---|---|---|---|---|
| 2024 | $2,568 | $100,600 | $12,700 | $87,900 |
| 2023 | $2,712 | $87,800 | $12,700 | $75,100 |
| 2022 | $2,646 | $83,700 | $12,700 | $71,000 |
| 2021 | $2,451 | $77,950 | $12,700 | $65,250 |
| 2020 | $2,430 | $77,950 | $12,700 | $65,250 |
| 2019 | $2,436 | $77,950 | $7,050 | $70,900 |
| 2018 | $2,399 | $77,950 | $7,050 | $70,900 |
| 2017 | $2,320 | $75,700 | $7,050 | $68,650 |
| 2016 | $2,076 | $73,500 | $7,050 | $66,450 |
| 2015 | $1,804 | $58,100 | $5,300 | $52,800 |
| 2014 | $1,705 | $52,800 | $5,300 | $47,500 |
| 2013 | $2,786 | $51,250 | $5,300 | $45,950 |
Source: Public Records
Map
Nearby Homes
- 1118 8th Ave S
- 1020 9th Ave S
- 910 University Dr S
- 820 10th St S Unit C20
- 1112 University Dr S
- 601 10th St S
- 1124 University Dr S
- 911 8th St S
- 513 10th St S
- 1124 5th Ave S
- 1414 10th Ave S
- 1208 University Dr S
- 1418 11th Ave S
- 505 8th St S
- 1301 10th St S
- 502 8th St S Unit 5
- 502 8th St S Unit 3
- 502 8th St S Unit 1
- 502 8th St S Unit 2
- 502 8th St S Unit 4