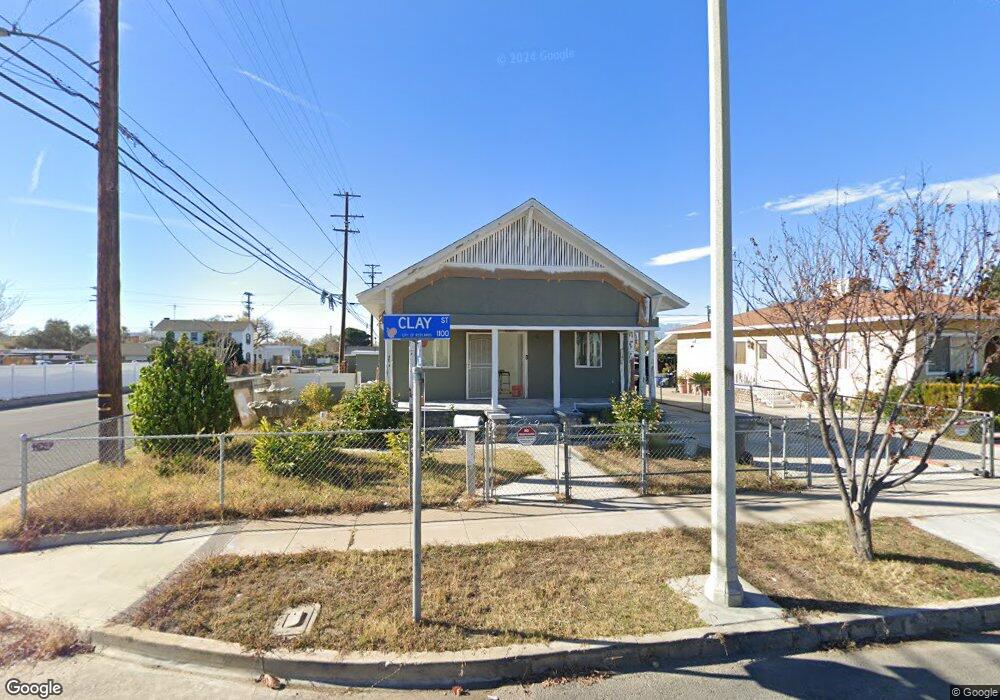
1103 Clay St Redlands, CA 92374
North Redlands NeighborhoodEstimated Value: $400,000 - $433,000
2
Beds
1
Bath
1,044
Sq Ft
$399/Sq Ft
Est. Value
About This Home
This home is located at 1103 Clay St, Redlands, CA 92374 and is currently estimated at $416,635, approximately $399 per square foot. 1103 Clay St is a home located in San Bernardino County with nearby schools including Kingsbury Elementary School, Moore Middle School, and Citrus Valley High School.
Ownership History
Date
Name
Owned For
Owner Type
Purchase Details
Closed on
May 10, 2023
Sold by
Mata Yuri
Bought by
Vines Theron L and Vines Geneil
Current Estimated Value
Purchase Details
Closed on
Nov 16, 2006
Sold by
Khan Mohammad A
Bought by
Rodriguez Susana
Home Financials for this Owner
Home Financials are based on the most recent Mortgage that was taken out on this home.
Original Mortgage
$225,040
Interest Rate
2%
Mortgage Type
Negative Amortization
Purchase Details
Closed on
Apr 5, 2006
Sold by
Miller William N and Miller Joyce S
Bought by
Khan Mohammad A
Home Financials for this Owner
Home Financials are based on the most recent Mortgage that was taken out on this home.
Original Mortgage
$173,000
Interest Rate
6.29%
Mortgage Type
Seller Take Back
Create a Home Valuation Report for This Property
The Home Valuation Report is an in-depth analysis detailing your home's value as well as a comparison with similar homes in the area
Home Values in the Area
Average Home Value in this Area
Purchase History
| Date | Buyer | Sale Price | Title Company |
|---|---|---|---|
| Vines Theron L | $330,000 | Fidelity National Title Compan | |
| Rodriguez Susana | $281,500 | Alliance Title Company | |
| Khan Mohammad A | $200,000 | Commonwealth Title |
Source: Public Records
Mortgage History
| Date | Status | Borrower | Loan Amount |
|---|---|---|---|
| Previous Owner | Rodriguez Susana | $225,040 | |
| Previous Owner | Khan Mohammad A | $173,000 |
Source: Public Records
Tax History Compared to Growth
Tax History
| Year | Tax Paid | Tax Assessment Tax Assessment Total Assessment is a certain percentage of the fair market value that is determined by local assessors to be the total taxable value of land and additions on the property. | Land | Improvement |
|---|---|---|---|---|
| 2025 | $4,000 | $343,332 | $103,000 | $240,332 |
| 2024 | $4,000 | $336,600 | $100,980 | $235,620 |
| 2023 | $4,662 | $392,700 | $117,300 | $275,400 |
| 2022 | $4,318 | $355,146 | $101,001 | $254,145 |
| 2021 | $3,747 | $296,200 | $89,000 | $207,200 |
| 2020 | $3,107 | $246,200 | $74,200 | $172,000 |
| 2019 | $2,992 | $239,000 | $72,000 | $167,000 |
| 2018 | $2,596 | $208,100 | $62,200 | $145,900 |
| 2017 | $2,538 | $201,100 | $60,100 | $141,000 |
| 2016 | $2,395 | $188,000 | $56,200 | $131,800 |
| 2015 | $2,237 | $174,000 | $52,000 | $122,000 |
| 2014 | $2,114 | $164,000 | $49,000 | $115,000 |
Source: Public Records
Map
Nearby Homes
- 1025 Clay St
- 1231 Webster St
- 1024 Lawton St
- 834 Calhoun St
- 932 6th St
- 1324 Clay St
- 1007 Lawton St
- 1218 6th St
- 1312 Calhoun St
- 527 Ruiz St
- 804 Tribune St
- 1450 Washington St
- 843 Carlotta Ct
- 1117 Oxford Dr
- 2167 Bergamot St
- 610 E Lugonia Ave Unit 4
- 1119 Church St
- 700 E Lugonia Ave
- 1510 Karon St
- 818 E Colton Ave