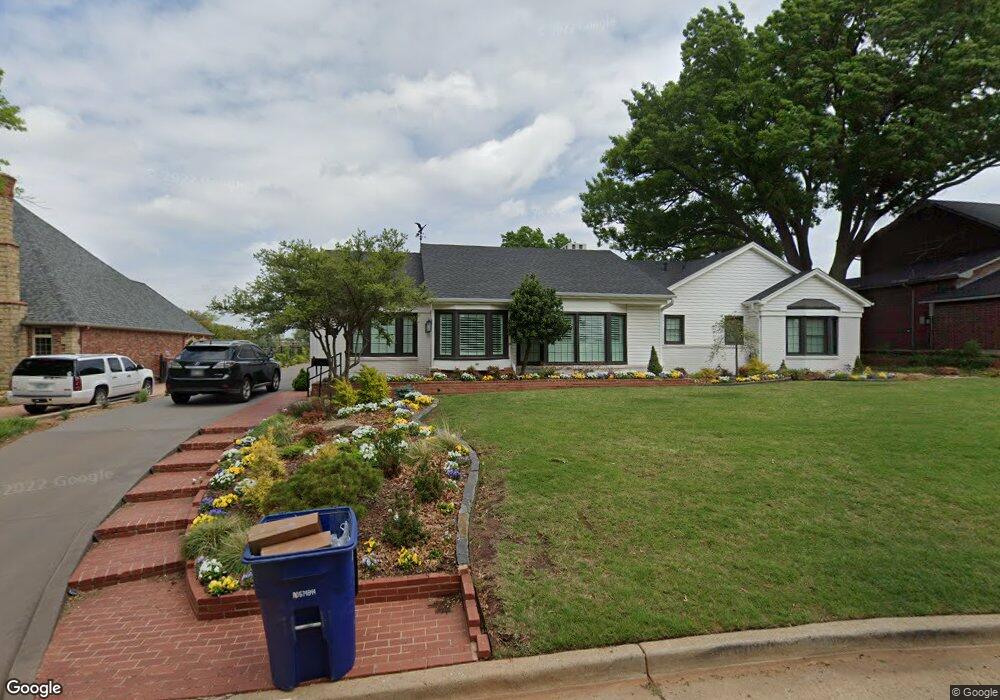
1103 Crescent Dr Duncan, OK 73533
Estimated Value: $365,536 - $416,000
4
Beds
4
Baths
4,217
Sq Ft
$90/Sq Ft
Est. Value
About This Home
This home is located at 1103 Crescent Dr, Duncan, OK 73533 and is currently estimated at $379,634, approximately $90 per square foot. 1103 Crescent Dr is a home located in Stephens County with nearby schools including Plato Elementary School, Duncan Middle School, and Duncan High School.
Ownership History
Date
Name
Owned For
Owner Type
Purchase Details
Closed on
Apr 11, 2023
Sold by
Mullins Brenda Kris
Bought by
Brenda Kris Mullins Revocable Trust
Current Estimated Value
Purchase Details
Closed on
Nov 16, 2020
Sold by
Murray Mary C and Murray Todd
Bought by
Mullins Brenda Kriss
Home Financials for this Owner
Home Financials are based on the most recent Mortgage that was taken out on this home.
Original Mortgage
$216,000
Interest Rate
2.8%
Mortgage Type
New Conventional
Purchase Details
Closed on
Apr 21, 2015
Sold by
Bostick Brent and Bostick Mary C
Bought by
Bostick Mary C
Purchase Details
Closed on
Mar 11, 2015
Sold by
Sigler Shelley Garvin and Sigler James M
Bought by
Bostick Mary C and Bostick Brent
Purchase Details
Closed on
Aug 5, 2011
Sold by
Garvin Harold T
Bought by
Garvin Harold T and Sigler Shelley Garvin
Create a Home Valuation Report for This Property
The Home Valuation Report is an in-depth analysis detailing your home's value as well as a comparison with similar homes in the area
Purchase History
| Date | Buyer | Sale Price | Title Company |
|---|---|---|---|
| Brenda Kris Mullins Revocable Trust | -- | None Listed On Document | |
| Mullins Brenda Kriss | $270,000 | Old Republic Title | |
| Bostick Mary C | -- | None Available | |
| Bostick Mary C | $212,500 | None Available | |
| Garvin Harold T | -- | None Available |
Source: Public Records
Mortgage History
| Date | Status | Borrower | Loan Amount |
|---|---|---|---|
| Previous Owner | Mullins Brenda Kriss | $216,000 |
Source: Public Records
Tax History
| Year | Tax Paid | Tax Assessment Tax Assessment Total Assessment is a certain percentage of the fair market value that is determined by local assessors to be the total taxable value of land and additions on the property. | Land | Improvement |
|---|---|---|---|---|
| 2025 | $2,604 | $31,865 | $2,596 | $29,269 |
| 2024 | $2,698 | $32,670 | $2,596 | $30,074 |
| 2023 | $2,698 | $32,670 | $2,596 | $30,074 |
| 2022 | $2,533 | $31,650 | $2,596 | $29,054 |
| 2021 | $2,461 | $29,898 | $2,596 | $27,302 |
| 2020 | $2,065 | $23,920 | $2,596 | $21,324 |
| 2019 | $1,971 | $22,781 | $2,596 | $20,185 |
| 2018 | $2,044 | $22,950 | $2,596 | $20,354 |
| 2017 | $1,970 | $22,919 | $2,596 | $20,323 |
| 2016 | $1,997 | $23,494 | $2,596 | $20,898 |
| 2015 | $1,255 | $17,081 | $1,954 | $15,127 |
| 2014 | $1,255 | $16,268 | $1,845 | $14,423 |
Source: Public Records
Map
Nearby Homes
- 1506 Crescent Dr
- 1110 Crescent Dr
- 1606 Indian Terrace
- 1001 W Jones Ave
- 907 Hillcrest Dr
- 1706 Northridge Dr
- 1125 Peck Ave
- 1423 N 7th St
- 1405 Evergreen Dr
- 1449 W Will Rogers Dr
- 1312 Mccasland Pkwy
- 1205 N 11th St
- 1202 N 12th St
- 1112 N 12th St
- 1216 N 8th St
- 2012 Park Dr
- 2110 W Club Rd
- 0 Townsend St
- 1061 N 8th St
- 2201 Sunset Dr
- 1105 Crescent Dr
- 1101 Crescent Dr
- 1510 Crescent Dr
- 1107 Crescent Dr
- 1102 Crescent Dr
- 1104 Crescent Dr
- 1508 Crescent Dr
- 1108 Crescent Dr
- 1109 Crescent Dr
- 1504 Crescent Dr
- 1501 Crescent Dr
- 1512 N Country Club Rd
- 1111 Crescent Dr
- 1105 W Elk Ave
- 1112 Crescent Dr
- 1508 N Country Club Rd
- 1518 N Country Club Rd
- 1113 Crescent Dr
- 1502 Crescent Dr
- 1506 N Country Club Rd
Your Personal Tour Guide
Ask me questions while you tour the home.