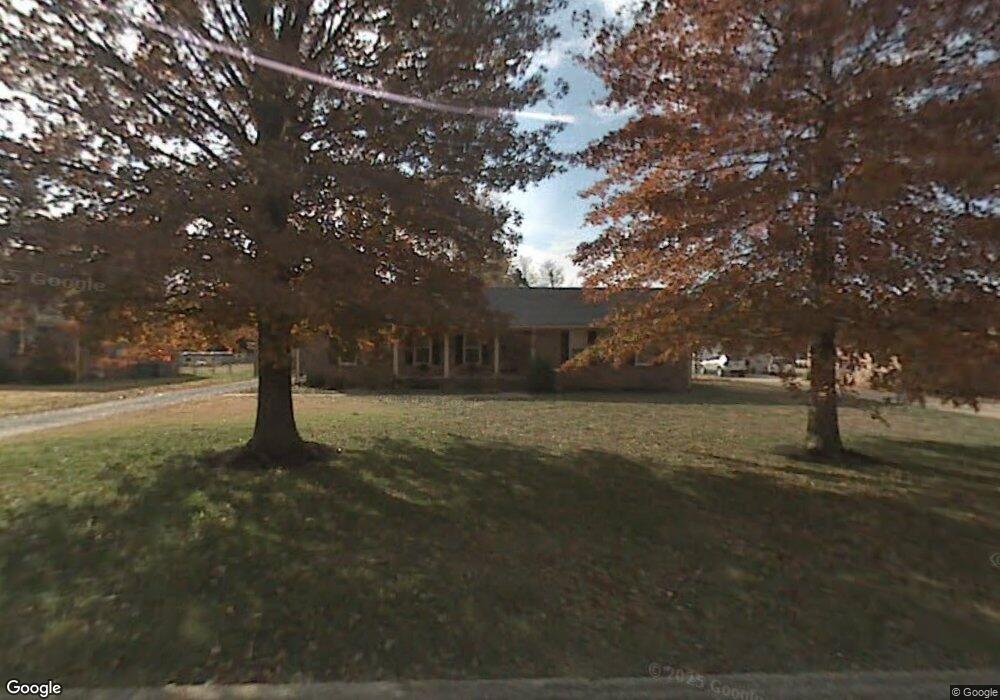
1103 Meadowbrook Rd Murfreesboro, TN 37129
Estimated Value: $315,000 - $389,000
--
Bed
3
Baths
1,592
Sq Ft
$228/Sq Ft
Est. Value
About This Home
This home is located at 1103 Meadowbrook Rd, Murfreesboro, TN 37129 and is currently estimated at $363,009, approximately $228 per square foot. 1103 Meadowbrook Rd is a home located in Rutherford County with nearby schools including Northfield Elementary School, Siegel Middle School, and Siegel High School.
Ownership History
Date
Name
Owned For
Owner Type
Purchase Details
Closed on
May 30, 2023
Sold by
Cti 1379 Llc
Bought by
Bti 1179 Llc
Current Estimated Value
Home Financials for this Owner
Home Financials are based on the most recent Mortgage that was taken out on this home.
Original Mortgage
$215,150
Outstanding Balance
$209,893
Interest Rate
6.88%
Mortgage Type
New Conventional
Estimated Equity
$153,116
Purchase Details
Closed on
Dec 7, 2011
Sold by
Hall Larry A
Bought by
Hall Kristi and Hall Larry A
Purchase Details
Closed on
Oct 8, 2008
Sold by
Hall Kristi
Bought by
Hall Larry A
Purchase Details
Closed on
Mar 27, 2006
Sold by
Womack Robert L
Bought by
Hall Larry A
Home Financials for this Owner
Home Financials are based on the most recent Mortgage that was taken out on this home.
Original Mortgage
$109,920
Interest Rate
8.38%
Mortgage Type
Purchase Money Mortgage
Purchase Details
Closed on
May 13, 1994
Sold by
Womack Nell P
Bought by
Womack Robert L
Create a Home Valuation Report for This Property
The Home Valuation Report is an in-depth analysis detailing your home's value as well as a comparison with similar homes in the area
Home Values in the Area
Average Home Value in this Area
Purchase History
| Date | Buyer | Sale Price | Title Company |
|---|---|---|---|
| Bti 1179 Llc | -- | None Listed On Document | |
| Cti 1379 Llc | $331,000 | Cti 1379 Llc | |
| Hall Kristi | -- | -- | |
| Hall Larry A | -- | -- | |
| Hall Larry A | $137,400 | -- | |
| Hall Larry A | $137,400 | -- | |
| Womack Robert L | -- | -- |
Source: Public Records
Mortgage History
| Date | Status | Borrower | Loan Amount |
|---|---|---|---|
| Open | Bti 1179 Llc | $215,150 | |
| Previous Owner | Hall Larry A | $109,920 |
Source: Public Records
Tax History Compared to Growth
Tax History
| Year | Tax Paid | Tax Assessment Tax Assessment Total Assessment is a certain percentage of the fair market value that is determined by local assessors to be the total taxable value of land and additions on the property. | Land | Improvement |
|---|---|---|---|---|
| 2025 | $2,168 | $76,650 | $13,750 | $62,900 |
| 2024 | $2,168 | $76,650 | $13,750 | $62,900 |
| 2023 | $1,438 | $76,650 | $13,750 | $62,900 |
| 2022 | $1,239 | $76,650 | $13,750 | $62,900 |
| 2021 | $1,121 | $50,500 | $11,250 | $39,250 |
| 2020 | $1,121 | $50,500 | $11,250 | $39,250 |
| 2019 | $1,121 | $50,500 | $11,250 | $39,250 |
| 2018 | $1,539 | $50,500 | $0 | $0 |
| 2017 | $1,471 | $37,850 | $0 | $0 |
| 2016 | $1,471 | $37,850 | $0 | $0 |
| 2015 | $1,471 | $37,850 | $0 | $0 |
| 2014 | $941 | $37,850 | $0 | $0 |
| 2013 | -- | $33,800 | $0 | $0 |
Source: Public Records
Map
Nearby Homes
- 2210 Tedder Blvd
- 1139 Victoria Dr
- 2606 Battleground Dr
- 519 Irongate Blvd
- 611 Concord Cir
- 2507 Regency Park Dr
- 1222 Myers Dr
- 615 Freedom Ct
- 2146 Berkshire Ln
- 610 Federal Ct
- 2651 James Edmon Ct
- 2707 Bertram Ct
- 2519 Regency Park Dr
- 528 Haviture Way
- 524 Haviture Way
- 615 Rohan Dr
- 611 Rohan Dr
- 609 Rohan Dr
- 514 Haviture Way
- 526 Rohan Dr
- 1107 Meadowbrook Rd
- 1015 Meadowbrook Rd
- 1102 Tomahawk Trace
- 1106 Tomahawk Trace
- 1014 Tomahawk Trace
- 1111 Meadowbrook Rd
- 1011 Meadowbrook Rd
- 1102 Meadowbrook Rd
- 1106 Meadowbrook Rd
- 1014 Meadowbrook Rd
- 1110 Tomahawk Trace
- 1010 Tomahawk Trace
- 1007 Meadowbrook Rd
- 1115 Meadowbrook Rd
- 1010 Meadowbrook Rd
- 1110 Meadowbrook Rd
- 1114 Tomahawk Trace
- 1006 Tomahawk Trace
- 1103 Tomahawk Trace
- 1015 Tomahawk Trace