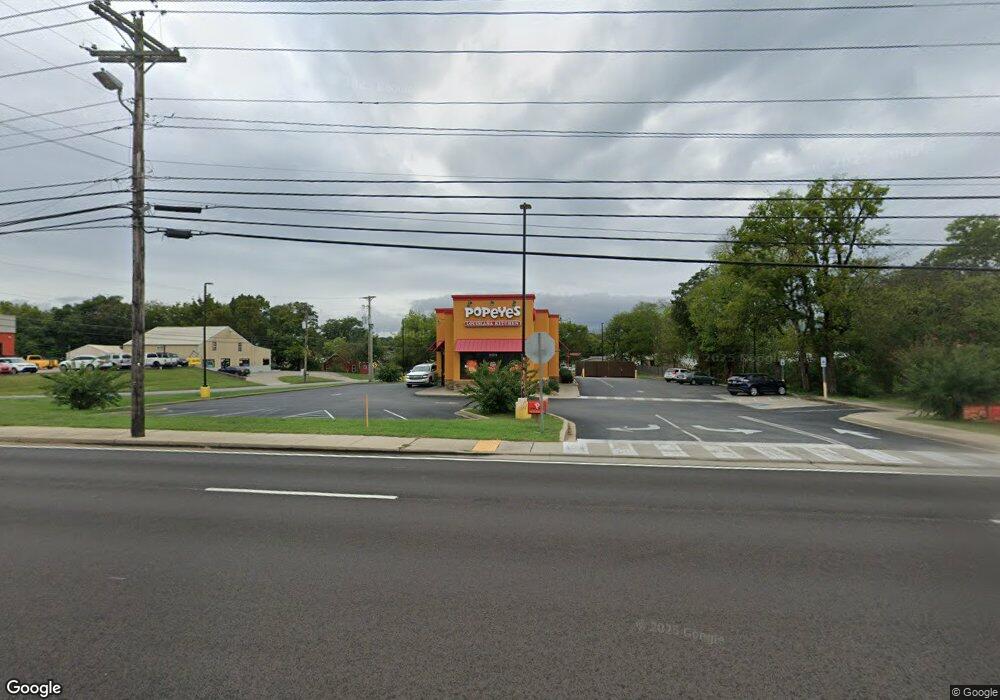
1103 N Main St Shelbyville, TN 37160
Estimated Value: $2,351,000
--
Bed
1
Bath
--
Sq Ft
0.75
Acres
About This Home
This home is located at 1103 N Main St, Shelbyville, TN 37160 and is currently priced at $2,351,000. 1103 N Main St is a home located in Bedford County with nearby schools including Eakin Elementary School, Harris Middle School, and Victory Baptist Academy.
Ownership History
Date
Name
Owned For
Owner Type
Purchase Details
Closed on
Mar 6, 2024
Sold by
Scullin Real Estate Iii Llc
Bought by
Aranda Family Trust and Aranda
Current Estimated Value
Purchase Details
Closed on
Feb 27, 2019
Sold by
Cambridge Franchise Real Estate Llc
Bought by
Scullin Real Estate Iii Llc
Purchase Details
Closed on
Feb 27, 2014
Sold by
Ass Walking Horse Trainers
Bought by
Arealco
Purchase Details
Closed on
Dec 14, 2005
Sold by
Turrentine Mitchell W
Bought by
Walking Horse Trainers Associa
Home Financials for this Owner
Home Financials are based on the most recent Mortgage that was taken out on this home.
Original Mortgage
$450,492
Interest Rate
6.28%
Purchase Details
Closed on
Jun 2, 1919
Bought by
Turrentine Willie Mai
Create a Home Valuation Report for This Property
The Home Valuation Report is an in-depth analysis detailing your home's value as well as a comparison with similar homes in the area
Home Values in the Area
Average Home Value in this Area
Purchase History
| Date | Buyer | Sale Price | Title Company |
|---|---|---|---|
| Aranda Family Trust | $2,152,015 | None Listed On Document | |
| Aranda Family Trust | $2,152,015 | None Listed On Document | |
| Scullin Real Estate Iii Llc | $2,168,700 | Stewart Title Company | |
| Arealco | $358,903 | -- | |
| Walking Horse Trainers Associa | $140,000 | -- | |
| Turrentine Willie Mai | -- | -- |
Source: Public Records
Mortgage History
| Date | Status | Borrower | Loan Amount |
|---|---|---|---|
| Previous Owner | Turrentine Willie Mai | $450,492 |
Source: Public Records
Tax History Compared to Growth
Tax History
| Year | Tax Paid | Tax Assessment Tax Assessment Total Assessment is a certain percentage of the fair market value that is determined by local assessors to be the total taxable value of land and additions on the property. | Land | Improvement |
|---|---|---|---|---|
| 2025 | -- | $115,000 | $0 | $0 |
| 2024 | -- | $115,000 | $115,000 | $0 |
| 2023 | $4,376 | $115,000 | $115,000 | $0 |
| 2022 | $4,503 | $115,000 | $115,000 | $0 |
| 2021 | $4,089 | $115,000 | $115,000 | $0 |
| 2020 | $4,113 | $115,000 | $115,000 | $0 |
| 2019 | $4,113 | $92,840 | $92,840 | $0 |
| 2018 | $4,020 | $92,840 | $92,840 | $0 |
| 2017 | $4,020 | $92,840 | $92,840 | $0 |
| 2016 | $4,472 | $104,240 | $101,520 | $2,720 |
| 2015 | $4,472 | $104,240 | $101,520 | $2,720 |
| 2014 | $3,776 | $96,325 | $0 | $0 |
Source: Public Records
Map
Nearby Homes
- 102 Saddlewood Dr
- 115 Scotland Heights
- 129 Annas Way
- 1017 Fairfield Pike
- 112 E Cedar St
- 134 Butler St
- 114 Collier Ave
- 0 Archery Ln
- 312 Cottonwood Dr
- 703 Deery St
- 178 Lucas Rd
- 1505 Green Ln
- 201 Hickory Dr
- 0 Hilltop Rd Unit RTC2897754
- 0 Hilltop Rd Unit RTC3001632
- 610 Sundance St
- 1507 Green Ln
- 102 Greystone Way
- 636 Deery St
- 1523 Green Ln
- 1101 N Main St
- 1111 N Main St
- 1110 Green Ln
- 115 Quarry St
- 1114 N Main St
- 1105 Green Ln
- 1107 Green Ln
- 1117 N Main St
- 1114 Green Ln
- 1109 Green Ln
- 1018 Lipscomb St
- 1116 N Main St
- 200 Quarry St
- 1016 Lipscomb St
- 100 Cottonwood Dr
- 1111 Green Ln
- 1119 N Main St
- 101 Cottonwood Dr
- 1027 Lipscomb St
- 1023 Lipscomb St