Estimated Value: $47,000 - $86,000
2
Beds
1
Bath
676
Sq Ft
$104/Sq Ft
Est. Value
About This Home
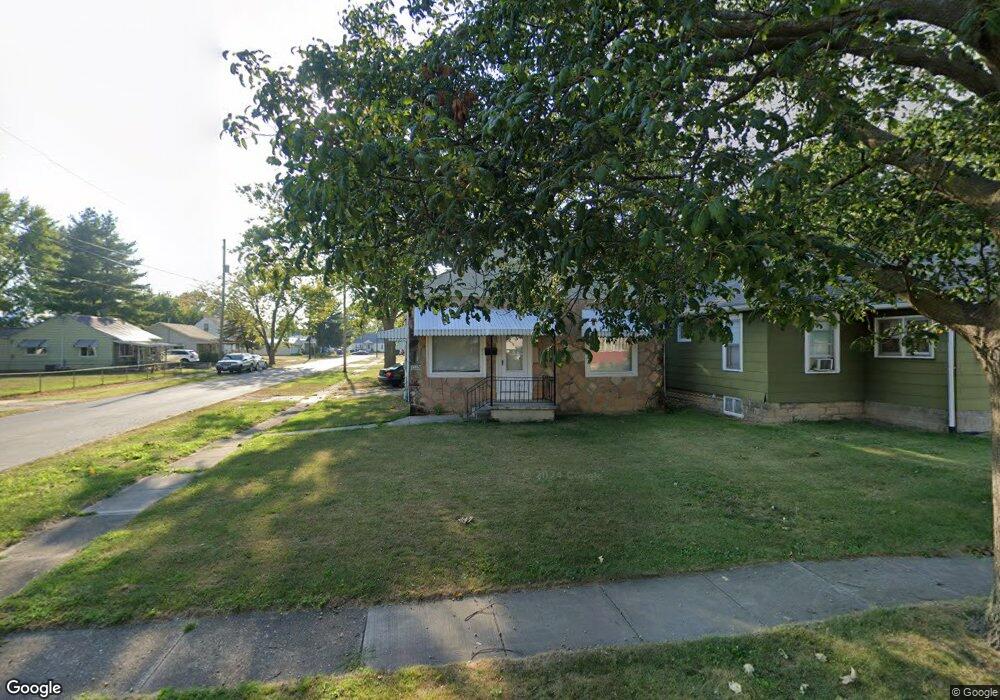
This home is located at 1103 N Union St, Lima, OH 45801 and is currently estimated at $70,343, approximately $104 per square foot. 1103 N Union St is a home located in Allen County with nearby schools including Independence Elementary School, Lima North Middle School, and Lima West Middle School.
Ownership History
Date
Name
Owned For
Owner Type
Purchase Details
Closed on
Mar 21, 2008
Sold by
The Huntington National Bank
Bought by
Optimal Investments Llc
Current Estimated Value
Purchase Details
Closed on
Nov 27, 2002
Sold by
Schaefer Randall A
Bought by
King Shelly L
Home Financials for this Owner
Home Financials are based on the most recent Mortgage that was taken out on this home.
Original Mortgage
$38,400
Interest Rate
6.22%
Mortgage Type
New Conventional
Purchase Details
Closed on
Jan 29, 2001
Sold by
Wickiser Lucille E
Bought by
Schafer Randall A and Schafer Teresa A
Home Financials for this Owner
Home Financials are based on the most recent Mortgage that was taken out on this home.
Original Mortgage
$28,150
Interest Rate
7.43%
Mortgage Type
New Conventional
Purchase Details
Closed on
Jan 1, 1990
Bought by
Wickiser D H
Create a Home Valuation Report for This Property
The Home Valuation Report is an in-depth analysis detailing your home's value as well as a comparison with similar homes in the area
Purchase History
We collect this data history from publicly available records. To have your information removed, we recommend requesting removal directly through your county’s website.
| Date | Buyer | Sale Price | Title Company |
|---|---|---|---|
| Optimal Investments Llc | $21,300 | None Available | |
| King Shelly L | $38,000 | -- | |
| Schafer Randall A | $31,300 | -- | |
| Wickiser D H | -- | -- |
Source: Public Records
Mortgage History
We collect this data history from publicly available records. To have your information removed, we recommend requesting removal directly through your county’s website.
| Date | Status | Borrower | Loan Amount |
|---|---|---|---|
| Previous Owner | King Shelly L | $38,400 | |
| Previous Owner | Schafer Randall A | $28,150 |
Source: Public Records
Tax History
| Year | Tax Paid | Tax Assessment Tax Assessment Total Assessment is a certain percentage of the fair market value that is determined by local assessors to be the total taxable value of land and additions on the property. | Land | Improvement |
|---|---|---|---|---|
| 2025 | $554 | $13,590 | $2,700 | $10,890 |
| 2024 | $551 | $13,590 | $2,700 | $10,890 |
| 2023 | $513 | $10,720 | $2,140 | $8,580 |
| 2022 | $507 | $10,720 | $2,140 | $8,580 |
| 2021 | $535 | $10,720 | $2,140 | $8,580 |
| 2020 | $512 | $9,070 | $2,070 | $7,000 |
| 2019 | $512 | $9,070 | $2,070 | $7,000 |
| 2018 | $512 | $9,070 | $2,070 | $7,000 |
| 2017 | $514 | $9,070 | $2,070 | $7,000 |
| 2016 | $519 | $9,070 | $2,070 | $7,000 |
| 2015 | $528 | $9,070 | $2,070 | $7,000 |
| 2014 | $573 | $10,150 | $2,030 | $8,120 |
| 2013 | $559 | $10,150 | $2,030 | $8,120 |
Source: Public Records
Map
Nearby Homes
- 136 E O'Connor Ave
- 108 E Edwards St
- 919 N Main St
- 1200 N Main St
- 123 Flanders Ave
- 501 W O'Connor Ave
- 735 N Elizabeth St
- 922 N Jefferson St
- 316 Ewing Ave
- 720 N West St
- 1021 N McDonel St
- 408 Runyan Ave
- 1416 N Central Ave
- 928 Burch Ave
- 406 Ewing Ave
- 215 W Michigan Ave
- 923 Burch Ave
- 557 W Ashton Ave
- 576 W Ashton Ave
- 730 N Main St
- 1040 N Main St
- 124 Mullen Ave
- 120 Mullen Ave
- 114 Mullen E
- 114 Mullen Ave
- 1053 N Union St
- 127 Mullen Ave
- 1044 N Main St
- 1048 N Main St
- 131 Mullen Ave
- 121 Mullen Ave
- 117 Mullen Ave
- 1042 N Main St
- 115 Mullen Ave
- 1105 N Union St
- 1032 N Main St
- 1031 N Union St
- 1034 N Main St
- 1109 N Union St
- 1080 N Main St
Your Personal Tour Guide
Ask me questions while you tour the home.